. 2021 Jul 15;27(14):4109-4125.
doi: 10.1158/1078-0432.CCR-21-1694. Epub 2021 May 25.

Single-Cell Characterization of the Immune Microenvironment of Melanoma Brain and Leptomeningeal Metastases

Affiliations

Single-Cell Characterization of the Immune Microenvironment of Melanoma Brain and Leptomeningeal Metastases

Inna Smalley et al. Clin Cancer Res. .

Abstract

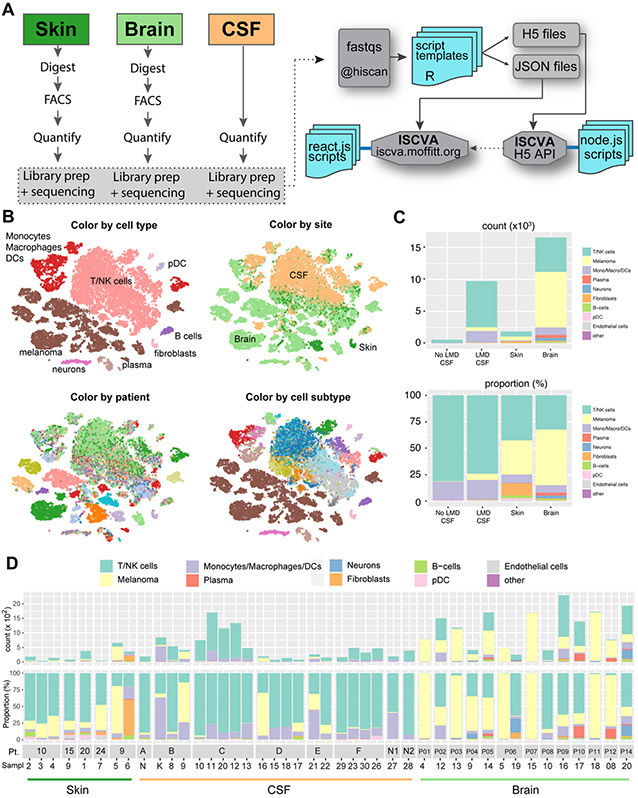
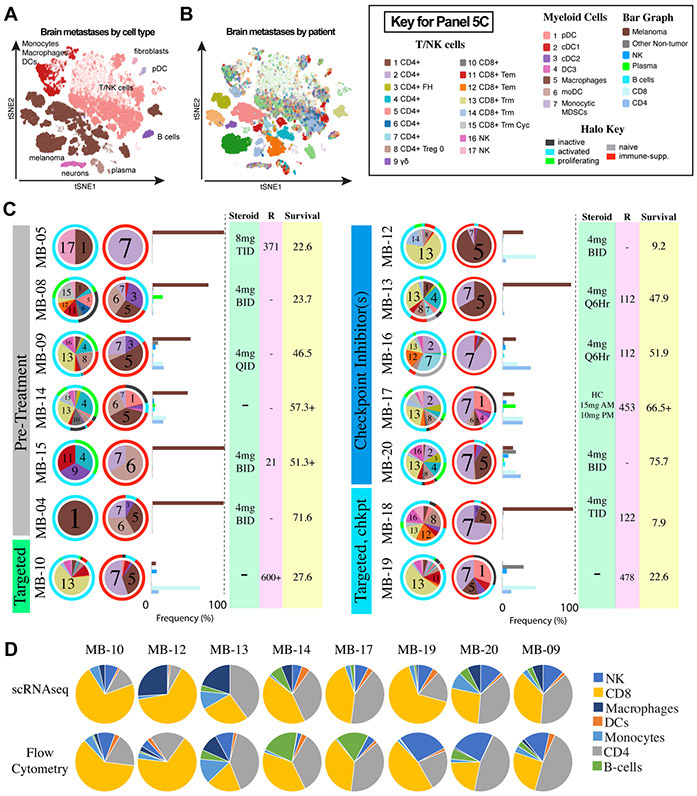
Purpose: Melanoma brain metastases (MBM) and leptomeningeal melanoma metastases (LMM) are two different manifestations of melanoma CNS metastasis. Here, we used single-cell RNA sequencing (scRNA-seq) to define the immune landscape of MBM, LMM, and melanoma skin metastases.

Experimental design: scRNA-seq was undertaken on 43 patient specimens, including 8 skin metastases, 14 MBM, and 19 serial LMM specimens. Detailed cell type curation was performed, the immune landscapes were mapped, and key results were validated by IHC and flow cytometry. Association analyses were undertaken to identify immune cell subsets correlated with overall survival.

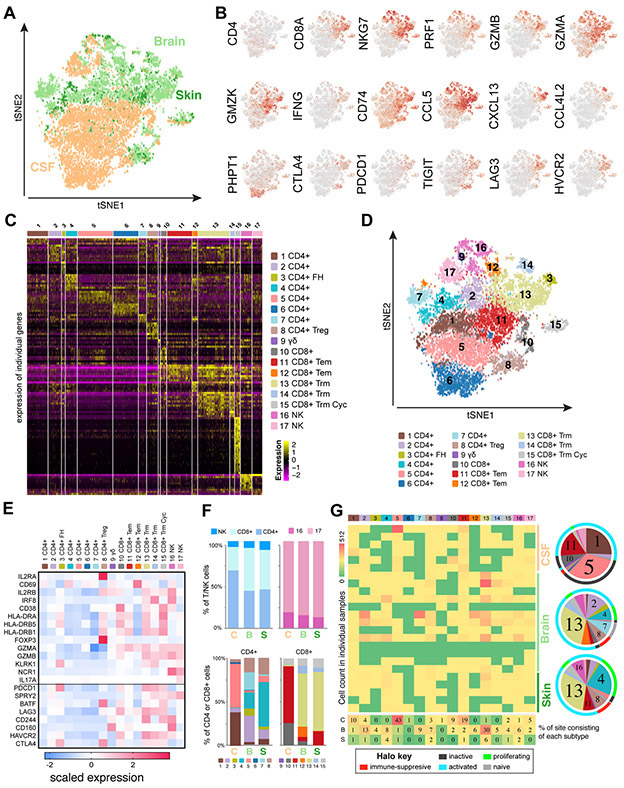
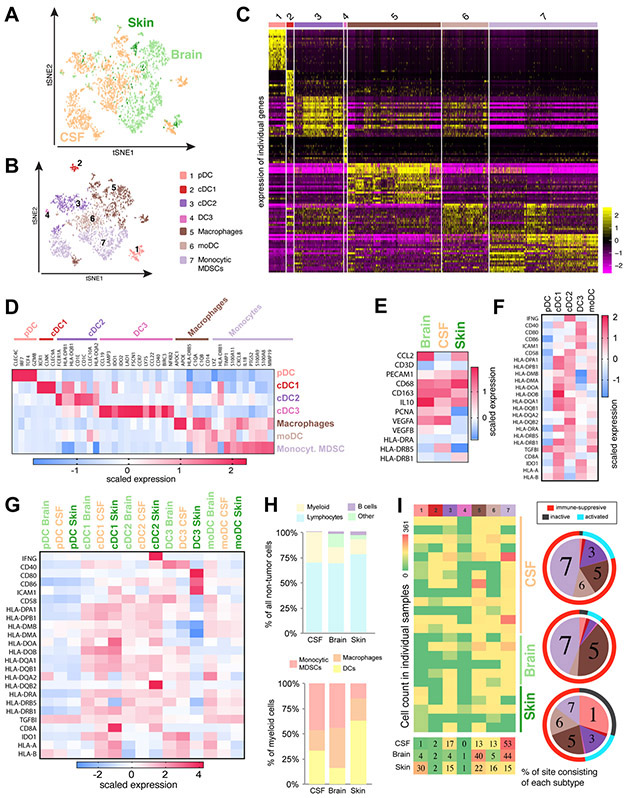
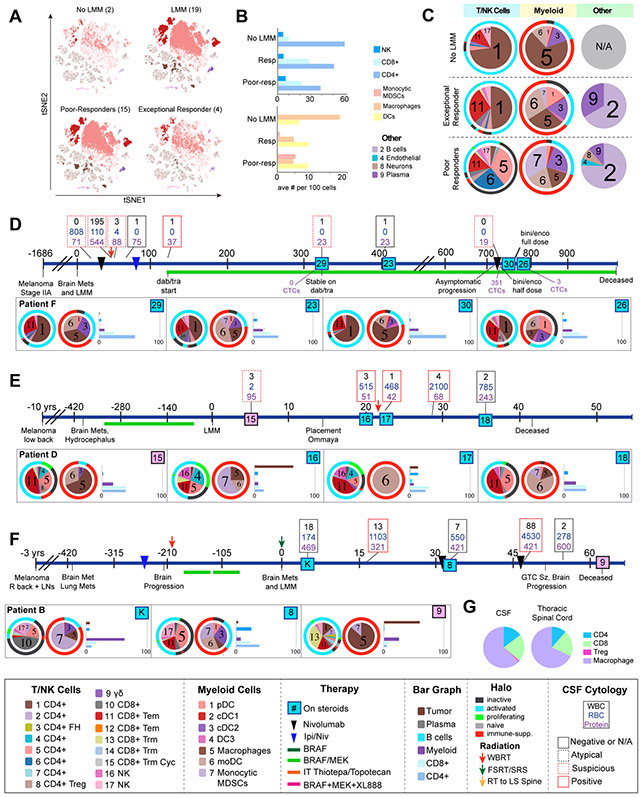
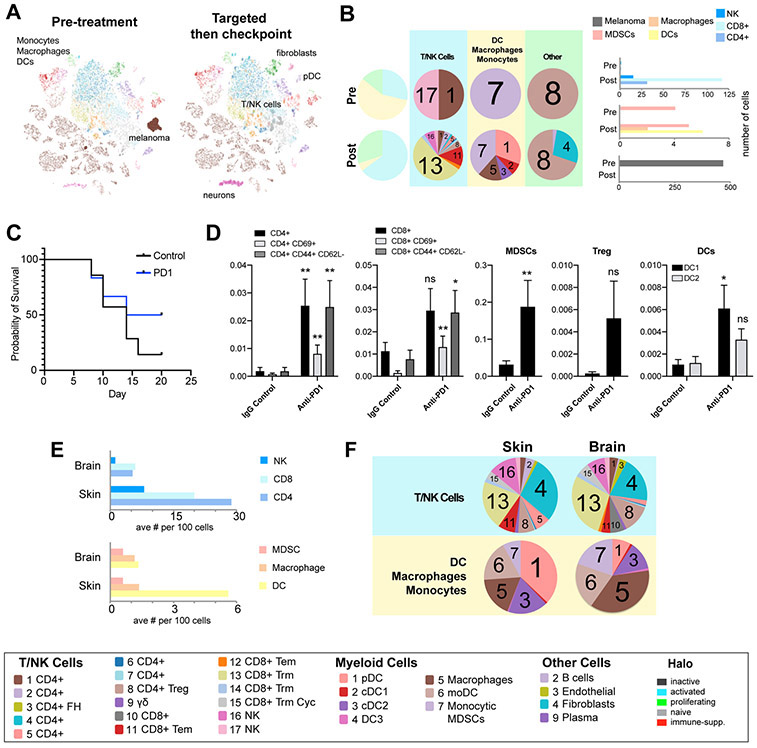
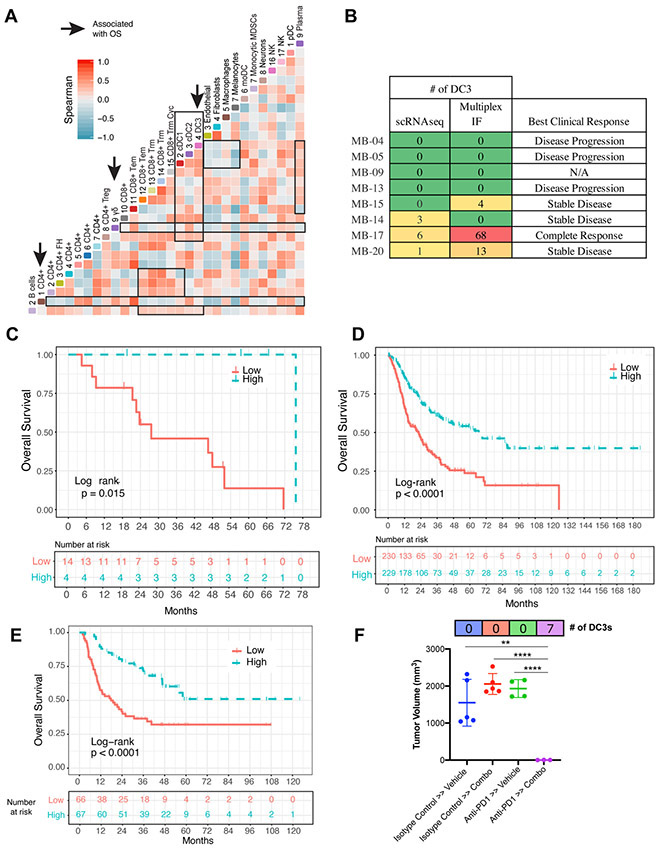
Results: The LMM microenvironment was characterized by an immune-suppressed T-cell landscape distinct from that of brain and skin metastases. An LMM patient with long-term survival demonstrated an immune repertoire distinct from that of poor survivors and more similar to normal cerebrospinal fluid (CSF). Upon response to PD-1 therapy, this extreme responder showed increased levels of T cells and dendritic cells in their CSF, whereas poor survivors showed little improvement in their T-cell responses. In MBM patients, therapy led to increased immune infiltrate, with similar T-cell transcriptional diversity noted between skin metastases and MBM. A correlation analysis across the entire immune landscape identified the presence of a rare population of dendritic cells (DC3) that was associated with increased overall survival and positively regulated the immune environment through modulation of activated T cells and MHC expression.

Conclusions: Our study provides the first atlas of two distinct sites of melanoma CNS metastases and defines the immune cell landscape that underlies the biology of this devastating disease.


Conflict of interest statement

Conflicts of interest: VKS is a consultant for Merck, Bristol-Myers Squibb and Regeneron and serves on the Data Safety Monitoring Boards for Bristol-Myers Squibb and Polynoma. ZE serves as an advisor for Array, Regeneron, SunPharma and has research funding from Novartis. AS receives research funding from Iovance Biotherapeutics Inc and Provectus Inc and is a paid consultant for Iovance Biotherapeutics. PF serves on the advisory board for Novocure, BTG, Inovio, AbbVie Inc., Ziopharm, and Tocagen. All other authors declare to no conflict of interest.

Figures

Figure 1:
Figure 1:. Defining the cellular landscape of melanomas metastatic to the skin, brain and leptomeninges.
A: Analysis workflow for each sample type (left), along with an overview of the ISCVA analysis platform (right). B: t-SNE plots showing major cell types identified, site of sample, source of cells by patient and annotation by cell subtype identified. C: Number of cells identified from each metastatic site by cell type count (upper panel) and cell type proportion (lower panel). D: Cellular landscape of each sample from the skin, cerebrospinal fluid (CSF) and brain. N1 and N2 are CSF samples from leukemia patients without LMM.
Figure 2:
Figure 2:. The T and NK cell landscape of melanoma metastases.
A: t-SNE plot showing the distribution of T and NK cells from melanoma metastatic to the skin, brain and leptomeninges. B: Expression of key T cell activation markers and immune checkpoints across all samples. C: Unsupervised clustering identifies 15 subsets of T cells and 2 sub-clusters of NK cells. D: t-SNE analysis showing distribution of T cell and NK cell clusters across all samples. E: Expression of T cell and NK cell activation markers across the 17 subsets of T cells and NK cells. F: T cell and NK landscape of melanoma samples metastatic to the leptomeninges (C), brain (B) and skin (S). High-level view by major T cell classes and NK cells (top panel) and composition by individual T and NK cell subcluster (lower). γδ T cells are included in the CD8 T cell groups due to their close relation in gene expression and function G: Distribution of T/NK cell sub-clusters by cell counts in individual samples and by percentage of each metastatic site containing individual sub-clusters (percent out of all T/NK cells). Pie charts show proportions of T and NK cell composition by metastatic site. Colored halo indicates predicted activation/exhaustion/proliferative status of each T and NK cell sub-cluster based on gene expression profiles across all metastatic sites. In case of serial samples from same individual, only the first sample is included in panels F and G.
Figure 3:
Figure 3:. The myeloid cell landscape of melanoma metastases.
A: t-SNE plot showing the distribution of myeloid cells in melanoma samples metastatic to the brain, skin and leptomeninges (CSF). B: t-SNE plot showing distribution of the 7 major clusters of myeloid cells. C: Unsupervised clustering identified the 7 major myeloid cell clusters in samples from melanoma metastases based on gene expression profiles. Note the high degree of heterogeneity in the cluster #7, monocytic MDSC-like cells. D: Expression of key markers that distinguish the major subsets of myeloid cells. E: Expression of macrophage markers across the macrophages at each site of metastasis. F: Expression levels of dendritic cell markers across the 5 identified sub-clusters of DC cells across all metastatic sites. G: Expression of dendritic cell markers in each DC sub-cluster at individual sites of metastasis. H: Myeloid cell landscape of melanoma samples metastatic to the leptomeninges (C), brain (B) and skin (S). High level view by major cell type clusters; lymphocytes, myeloid cells, B cells and other (top panel) and composition by major myeloid cell sub-cluster (lower). I: Distribution of myeloid cell sub-clusters by cell counts in individual samples and by percentage of each metastatic site containing individual sub-clusters (percent out of all myeloid cells). Pie charts show myeloid cell composition by metastatic site. Colored halo indicates predicted activation/inactivation and immune suppressive status of each myeloid cell sub-cluster based on gene expression profiles across all metastatic sites. In case of serial samples from same individual, only the first sample is included in panels H and I.
Figure 4:
Figure 4:. The immune environment of cerebrospinal fluid (CSF) from patients with leptomeningeal melanoma metastases (LMM) is immunosuppressed.
A: t-SNE analysis of CSF from patients without LMM and with LMM. These samples were then separated into those from patients without LMM (No LMM), an LMM patient with long survival (38+ mo, Exceptional Responder) and those with poor survival (1-4 mo., Poor-Responders). B: High-level overview of the cellular landscape of CSF from non-LMM patients (no-LMM), CSF from exceptional responder (Resp) and the poor survivors (Poor-resp). Breakdown by major lymphocytic and myeloid cell types. C: Cell type distribution of LMM samples from patients without LMM, the exceptional responder and the poor responders. Detailed breakdown of cell phenotypes for T/NK cells, myeloid cells and other cells. Bars indicate cell sub-clusters. Halo indicates predicted behavior of each cell sub-cluster (e.g. inactive, activated, proliferating, naïve and immune suppressive). D: Treatment timeline of the exceptional responder (Patient F), indicating how therapeutic intervention modulates the cellular landscape. Figure shows therapy timeline by day, along with pertinent clinical information. Lower panel includes snapshots of each sequential sample, with pie charts showing the changing cellular landscape on therapy for T cells (left pie chart) and myeloid cells (right pie chart). Halo indicates predicted behavior of each cell sub-cluster (e.g. inactive, activated, proliferating, naïve and immune suppressive). Bar graph shows percent of tumor made up of tumor cells, plasma, B cells, myeloid cells and CD4 or CD8 T cells, normalized to every 100 cells analyzed. E-F: Treatment timeline of two poor responders (Patients D, B), with accompanying cellular landscape information as panel D, showing much greater proportion of T cell compartment to be comprised of inactive T cell sub-classes and a greater portion of the myeloid cell compartment to be comprised of immune-suppressive cell sub-classes. G. Orthogonal comparison of scRNAseq of CSF and multiplex IF staining of the thoracic spinal cord of the same patient (Patient B) harvested at autopsy shows the CSF sample to be representative of the tumor found directly on the leptomeninges and highlights consistency between scRNAseq and flow cytometry based methods of immune cell analysis.
Figure 5:
Figure 5:. Systemic therapy shapes the cellular landscape of melanoma brain metastasis.
A: t-SNE plot showing the cell landscape of brain metastasis samples distribution by major cell types, and B distribution by individual patient. C: Cellular landscapes of individual MBM samples grouped by history of systemic therapy. Pie charts show the changing cellular landscape on therapy for T cells (left pie chart) and myeloid cells (right pie chart). Halo indicates predicted behavior of each cell sub-cluster (e.g. inactive, activated, proliferating, naïve and immune suppressive). Bar graphs show percent of tumor made up of tumor cells, plasma, B cells, myeloid cells and CD4 or CD8 T cells, normalized to every 100 cells analyzed. Each sample is also annotated with correlative clinical information, including steroid use at time of tumor sampling, radiation therapy (days prior to collection), and survival time of the patient (in months). D: Orthogonal validation of cell type proportions between matched samples of brain metastases analyzed by scRNAseq and flow cytometry.
Figure 6:
Figure 6:. Systemic therapy leads to the trafficking of immune cells into MBM.
A: t-SNE analysis of the treatment-induced changes in the immune landscape of a single patient with serial brain metastasis resections collected prior to therapy and following therapy. Cells present in a sample are highlighted in larger size and are brightly colored. Small, faintly colored dots represent all cells analyzed. B: Cellular landscape in the matched MBM samples pre- vs. post- systemic therapy (targeted therapy for 3 mo followed by 9 month gap, then immunotherapy 3 wk prior to resection) in the same patient. C: Model of mouse melanoma brain metastasis using SM1 cells stereotactically injected into the brain of C57BL/6J mice. Mice were treated with isotype control or anti-PD1 antibody every 5 days until endpoint. D: Immunophenotyping of mouse tumors harvested at endpoint using flow cytometry shows an influx of immune infiltrate in the tumors of anti-PD1 treated mice. P-value denoted as * ≤ 0.05, **≤ 0.01, and ns > 0.05 E: Cellular make up of treatment naïve samples from skin metastases vs MBM by T/NK and myeloid cell clusters, normalized to every 100 cells analyzed. F: Cellular landscape from the samples in (E) by cell type and subcluster proportions. For panels B and E, γδ T cells are included in the CD8 T cell groups due to their close relation in gene expression and function.
Figure 7:
Figure 7:. The presence of DC3s positively shape the immune environment.
A: Correlation analysis among all identified cell types. Data shows heatmap of the Spearman Rank correlation among all cell types. B: Multiplex IF staining for DAPI+, LAMP3+, IDO1+ and CCL19+ cells confirms presence of DC3 cells in MBM specimens in patients. Best response indicated refers to all disease sites. C: Overall survival for melanoma patients with brain or skin metastases whose melanoma samples contained DC3 cells vs. those who did not. D: Validation of DC3 association with survival in TCGA melanoma dataset (N=459). Overall survival for patients whose melanoma samples contained high vs low DC3 cell markers (LAMP3, CCL19, IDO1 and IDO2) shown as PC1 expression levels. Correlations among the 4 genes and PC1 loading is shown in Supplemental Figure 6. E: Additional validation of DC3 association with survival in a Moffitt melanoma dataset (N=135). F: DC3s are detected in mice with melanoma who responded favorably to the PD-1-ceritinib-trametinib sequence. SW1 mouse melanoma cells were grown sub-cutaneously in C3H/HeNCrl mice and were then treated sequentially with 1) IgG control-vehicle, 2) IgG-control- targeted therapy (ceritinib (25 mg/kg) and trametinib (1 mg/kg), immune checkpoint inhibitor (anti-PD1: 200ug/ul)->vehicle, or 4) PD-1->ceritinib-trametinib. Tumors were harvested at endpoint (day 20 for Isotype control >> vehicle and Anti-PD1>> vehicle) or end of experiment (day 41 for Isotype control >> combo and Anti-PD-1 >> combo) and assessed for presence of DC3s using scRNAseq. Asterisk denotes p-value **≤ 0.01 and ****≤0.0001.

References

    1. Damsky WE, Theodosakis N, Bosenberg M. Melanoma metastasis: new concepts and evolving paradigms. Oncogene 2014;33(19):2413–22 doi 10.1038/onc.2013.194. - DOI - PubMed
    1. Balch CM. Cutaneous melanoma. St. Louis, Mo.: Quality Medical Pub.; 2003. xxiii, 799 p. p.
    1. Kenchappa RS, Tran N, Rao NG, Smalley KS, Gibney GT, Sondak VK, et al. Novel Treatments for Melanoma Brain Metastases. Cancer Control 2013;20(4):298–306. - PubMed
    1. Raizer JJ, Hwu WJ, Panageas KS, Wilton A, Baldwin DE, Bailey E, et al. Brain and leptomeningeal metastases from cutaneous melanoma: Survival outcomes based on clinical features. Neuro-Oncology 2008;10(2):199–207 doi 10.1215/15228517-2007-058. - DOI - PMC - PubMed
    1. Harstad L, Hess KR, Groves MD. Prognostic factors and outcomes in patients with leptomeningeal melanomatosis. Neuro-Oncology 2008;10(6):1010–8 doi 10.1215/15228517-2008-062. - DOI - PMC - PubMed

Publication types

MeSH terms