. 2021 May 25;6(59):eabh1516.
doi: 10.1126/sciimmunol.abh1516.

Polyclonal expansion of TCR Vbeta 21.3+ CD4+ and CD8+ T cells is a hallmark of Multisystem Inflammatory Syndrome in Children

Affiliations

Polyclonal expansion of TCR Vbeta 21.3+ CD4+ and CD8+ T cells is a hallmark of Multisystem Inflammatory Syndrome in Children

Marion Moreews et al. Sci Immunol. .

Abstract

Multiple Inflammatory Syndrome in Children (MIS-C) is a delayed and severe complication of SARS-CoV-2 infection that strikes previously healthy children. As MIS-C combines clinical features of Kawasaki disease and Toxic Shock Syndrome (TSS), we aimed to compare the immunological profile of pediatric patients with these different conditions. We analyzed blood cytokine expression, and the T cell repertoire and phenotype in 36 MIS-C cases, which were compared to 16 KD, 58 TSS, and 42 COVID-19 cases. We observed an increase of serum inflammatory cytokines (IL-6, IL-10, IL-18, TNF-α, IFNγ, CD25s, MCP1, IL-1RA) in MIS-C, TSS and KD, contrasting with low expression of HLA-DR in monocytes. We detected a specific expansion of activated T cells expressing the Vβ21.3 T cell receptor β chain variable region in both CD4 and CD8 subsets in 75% of MIS-C patients and not in any patient with TSS, KD, or acute COVID-19; this correlated with the cytokine storm detected. The T cell repertoire returned to baseline within weeks after MIS-C resolution. Vβ21.3+ T cells from MIS-C patients expressed high levels of HLA-DR, CD38 and CX3CR1 but had weak responses to SARS-CoV-2 peptides in vitro. Consistently, the T cell expansion was not associated with specific classical HLA alleles. Thus, our data suggested that MIS-C is characterized by a polyclonal Vβ21.3 T cell expansion not directed against SARS-CoV-2 antigenic peptides, which is not seen in KD, TSS and acute COVID-19.


Figures

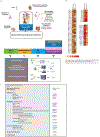
Figure 1.
Figure 1.. Study design and clinical features of MIS-C patients
(A) Outline of the study including MIS-C, KD, TSS and acute COVID-19 patients and the immunological investigation workflow. (B) Heatmap showing the TSS or KD clinical score for TSS, MIS-C and KD patients included in our study, calculated as the number of major criteria reached for each disease. (C) Clinical description of all MIS-C patients included in the study.
Figure 2.
Figure 2.. Systemic inflammation and signs of immune paralysis in MIS-C patients
(A) Left panel: Interferon score calculated as the normalized mean expression of six ISGs measured using the Nanostring technology, as previously described (44, 50). Middle panel: Serum IFN-α, in different groups of patients, as measured with the Simoa technology. Right panel: Serum IFN-γ level measured by Elisa. N=3 to 30 per group, as indicated in Table S2; Statistical test: multiple comparisons and correction using Benjamini-Hochberg procedure. (B). Serum levels of the indicated cytokines as measured by automated ELISA. N=5 to 30 per group, as indicated in Table S2; Statistical test: multiple comparisons and correction using Benjamini-Hochberg procedure. (C) Table showing the statistical results of the comparison of cytokine levels between MIS-C and other groups, as indicated. (D) T, B and NK lymphocyte counts measured by flow cytometry in MIS-C and KD. The grey bar indicates the normal range in healthy donors . N=3 to 13 per group, as indicated in Table S2. (E) HLA-DR expression in T cells and monocytes, as measured by flow cytometry in MIS-C. The grey bar indicates the normal range in healthy donors. *P < 0.05, **P < 0.01, ***P < 001.
Figure. 3.
Figure. 3.. Polyclonal Vb21.3+ T cell expansion in MIS-C patients
(A) Frequency of total CD3+ T cells expressing the indicated V-beta (Vβ) chains, as measured by flow cytometry using specific antibodies against the corresponding Vβ within PBMCs of patients of the indicated group. TSS, mild COVID-19, pediatric COVID-19 (ped-COVID), KD and MIS-C patients are colored in blue, pink, dark blue, orange and green respectively. The red color highlights values at least twice higher as the mean frequency in the general adult population. (B) Normalized frequency of Vβ21.3+ T cells in different clinical conditions, as indicated. N=5 to 26 per group, as indicated in Table S2; Statistical test: Mann-Withney using FDR adjustment. (C-D) Serum IL-18 (C) and IL-1RA (D) levels in MIS-C patients with or without Vβ21.3+ T cell expansions (exp). N=6 to 11 per group, as indicated in Table S2; Statistical test: Mann-Withney. (E-G) Chord diagrams of the TRBV (bottom, grey) and TRBJ (top, blue) combinations assessed by TCR sequencing of TCRab chains in whole blood of MIS-C patients. The relative frequency of all TRBVBJ combinations have been calculated per sample on the full TRB repertoire data. Combinations using TRBV11-2 are highlighted in red. Each red line indicates pairing with a given TRBJ, the thickness indicates the frequency of this pairing. The percentage values under each chart indicate the percentage of clonotypes composed with the TRBV11-2 gene. In (E-G) the CDR3 length distribution of clonotypes using TRBV11-2 is shown as an histogram graph. Each clonotype is represented as a grey line. The thickness of the line represents the frequency of the clonotype within each repertoire. Since most of the clonotypes are not abundant, all the grey lines are stacked together and appear as a unique grey bar, which reflect the lack of expansion. Expanded clonotypes identified as detailed in the method section are shown in red. In (F-G) the same four patients are shown during the MIS-C episode (F) and after resolution (G). (H) Frequency of Vβ21.3+ T cells at different time points during and after the MIS-C episode in different patients, as assessed by flow cytometry. N=11, as indicated in Table S2. (I) Annexin-V staining of T cells in the indicated patients groups. Results show the ratio of the Annexin-V fluorescence in Vβ21.3+ vs Vβ21.3- T cells. N=3-4 in each group. Statistics were calculated using the Mann-Withney test.
Figure 4.
Figure 4.. T cell activation within Vβ21.3 and stimulation of T cells with viral peptides in vitro.
(A-D) Flow cytometry analysis of CD38 and HLA-DR expression in CD4 or CD8 T cells from the indicated patients’ groups (exp: Vβ21.3+ T cell expansion). (A) shows a representative staining, and (B) shows the mean +/−SD frequency of CD38+HLA-DR+ CD4 (top) and CD8 (bottom) T cells. N=3 to 4 per group, as indicated in Table S2; Statistical test: Mann-Withney using FDR adjustment. (C-D) A Vβ21.3+ antibody was also included in the flow cytometry panel used in (A-B) allowing a specific comparison of the Vβ21.3− and Vβ21.3+ T cells in MIS-C patients. (C) shows a representative dot plot of CD38 and HLA-DR expression in the indicated subsets; (D) mean +/−SD frequency of CD38+HLA-DR+ in the indicated CD4 (top) and CD8 (bottom) T cell subsets. N=3 to 4 per group, as indicated in Table S2; Statistical test: Mann-Withney. (E) Frequency of CX3CR1+ cells in gated Vβ21.3− and Vβ21.3+ CD4+ (left) and CD8+ (right) T cells in MIS-C without and MIS-C with expansion. (F) PBMCs from control, COVID-19 (adults, 6 months post infection) or MIS-C patients (with or without Vβ21.3+ T cell expansions) were stimulated for 6h with a commercial cocktail of synthetic peptides from S, N, and M SARS-CoV2 proteins in the presence of Golgi secretion inhibitors. Intracellular IFNγ expression was then measured in T cells by flow cytometry. The fold increase was calculated as the ratio between the stimulated and the unstimulated conditions. N=5 to 9 per group, as indicated in Table S2; Statistical test: Mann-Withney using FDR adjustment. (G) shows the frequency of Vβ21.3+ and Vβ21.3− T cells expressing IFN-γ after stimulation with S, N, M SARS-CoV2 peptides in the different patient groups as indicated (one dot: one patient).

References

    1. Riphagen S, Gomez X, Gonzalez-Martinez C, Wilkinson N, Theocharis P, Hyperinflammatory shock in children during COVID-19 pandemic. The Lancet. 395, 1607–1608 (2020). - PMC - PubMed
    1. Verdoni L, Mazza A, Gervasoni A, Martelli L, Ruggeri M, Ciuffreda M, Bonanomi E, D’Antiga L, An outbreak of severe Kawasaki-like disease at the Italian epicentre of the SARS-CoV-2 epidemic: an observational cohort study. The Lancet. 0 (2020), doi:10.1016/S0140-6736(20)31103-X. - DOI - PMC - PubMed
    1. Belot A, Antona D, Renolleau S, Javouhey E, Hentgen V, Angoulvant F, Delacourt C, Iriart X, Ovaert C, Bader-Meunier B, Kone-Paut I, Levy-Bruhl D, SARS-CoV-2-related paediatric inflammatory multisystem syndrome, an epidemiological study, France, 1 March to 17 May 2020. Eurosurveillance. 25, 2001010 (2020). - PMC - PubMed
    1. Levin M, Childhood Multisystem Inflammatory Syndrome - A New Challenge in the Pandemic. N. Engl. J. Med (2020), doi:10.1056/NEJMe2023158. - DOI - PMC - PubMed
    1. Dufort EM, Koumans EH, Chow EJ, Rosenthal EM, Muse A, Rowlands J, Barranco MA, Maxted AM, Rosenberg ES, Easton D, Udo T, Kumar J, Pulver W, Smith L, Hutton B, Blog D, Zucker H, New York State and Centers for Disease Control and Prevention Multisystem Inflammatory Syndrome in Children Investigation Team, Multisystem Inflammatory Syndrome in Children in New York State. N. Engl. J. Med (2020), doi:10.1056/NEJMoa2021756. - DOI - PMC - PubMed

Publication types

MeSH terms

Supplementary concepts