. 2021 Jul 14;41(28):5994-6005.
doi: 10.1523/JNEUROSCI.2790-20.2021.

Increased Visual Sensitivity and Occipital Activity in Patients With Hemianopia Following Vision Rehabilitation

Affiliations

Increased Visual Sensitivity and Occipital Activity in Patients With Hemianopia Following Vision Rehabilitation

Sara Ajina et al. J Neurosci. .

Abstract

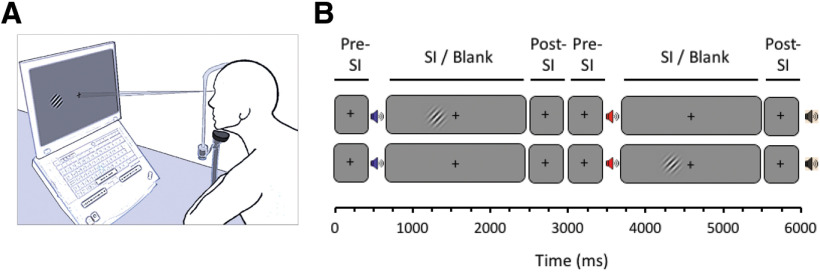
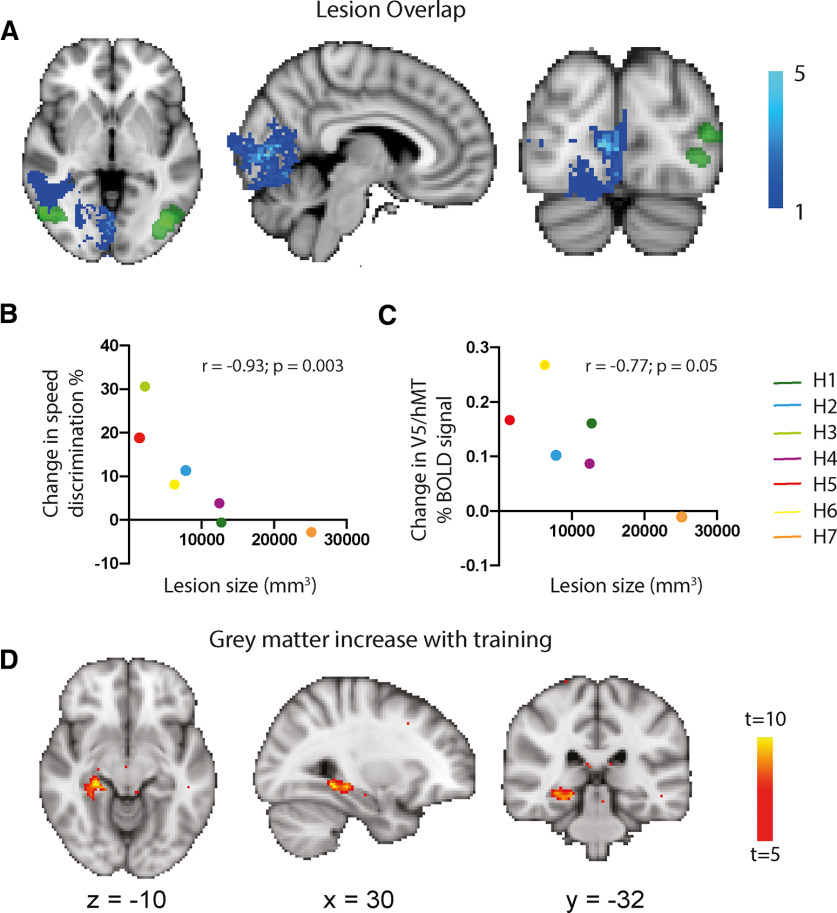
Hemianopia, loss of vision in half of the visual field, results from damage to the visual pathway posterior to the optic chiasm. Despite negative effects on quality of life, few rehabilitation options are currently available. Recently, several long-term training programs have been developed that show visual improvement within the blind field, although little is known of the underlying neural changes. Here, we have investigated functional and structural changes in the brain associated with visual rehabilitation. Seven human participants with occipital lobe damage enrolled in a visual training program to distinguish which of two intervals contained a drifting Gabor patch presented within the blind field. Participants performed ∼25 min of training each day for 3-6 months and undertook psychophysical tests and a magnetic resonance imaging scan before and after training. A control group undertook psychophysical tests before and after an equivalent period without training. Participants who were not at ceiling on baseline tests showed on average 9.6% improvement in Gabor detection, 8.3% in detection of moving dots, and 9.9% improvement in direction discrimination after training. Importantly, psychophysical improvement only correlated with improvement in Humphrey perimetry in the trained region of the visual field. Whole-brain analysis showed an increased neural response to moving stimuli in the blind visual field in motion area V5/hMT. Using a region-of-interest approach, training had a significant effect on the blood oxygenation level-dependent signal compared with baseline. Moreover, baseline V5/hMT activity was correlated to the amount of improvement in visual sensitivity using psychophysical and perimetry tests. This study, identifying a critical role for V5/hMT in boosting visual function, may allow us to determine which patients may benefit most from training and design adjunct interventions to increase training effects.SIGNIFICANCE STATEMENT Homonymous visual field loss is a common consequence of brain injury and is estimated to affect more than 230,000 people in the United Kingdom. Despite its high prevalence and well-described impact on quality of life, treatments to improve visual sensitivity remain experimental, and deficits are considered permanent after 6 months. Our study shows that behavioral changes following vision rehabilitation are associated with enhanced visually-evoked occipital activity to stimuli in the blind visual field. Unlike previous behavioral studies, we observe clinical changes that are specific to the trained region of vision. This lends significant weight to such training paradigms and offers a mechanism by which visual function can be improved despite damage to the primary visual pathway.

Keywords: V5/hMT; cortical blindness; functional MRI; hemianopia; perimetry; rehabilitation.


Figures

Figure 1.
Figure 1.
A, Rehabilitation setup in patients' homes. Participants sat with their head on a chin rest at a distance of 40 cm from the monitor, mounted on a frame. B, The training task consisted of a 2-AFC temporal detection task in which a spatially and temporally modulated Gabor patch was presented in one of two intervals while the participant maintained central fixation. The target contrast was algorithmically controlled to maintain difficulty. Participants provided their response by pressing the left or right response buttons, and positive auditory feedback was provided if they were correct. Each training session lasted ∼25 min, with a 3 min rest imposed halfway through the session. SI, Stimulus interval.
Figure 2.
Figure 2.
Structural images for all seven participants, with the location of damage indicated by the arrow. Visual field deficits are adapted from 30:2 threshold Humphrey visual field perimetry reports and show dense visual field loss in black (<0.5%) and partial loss in gray (<2%). Stimulus training and testing location (indicated by the white circle superimposed on the black region) was different for each participant and restricted to a region of dense visual field loss. Concentric rings represent increments in retinal position of 10°, spanning the central 30°.
Figure 3.
Figure 3.
Training performance and behavioral improvement measured before and after training. A, The adaptation of individual training parameters with performance over the home training period. Blue lines represent performance on the 2-AFC detection task throughout training (left y-axis), with the contrast of the training stimulus shown by the dotted red line (right y-axis). The stimulus contrast reduces when performance is consistently ≥84%, and ranges between 5 and 95%. Superimposed on the performance curves are lines of best fit (thin black lines), calculated for any period lasting >10 sessions duration where the contrast level remained constant. Where positive, this indicates an overall improvement in performance over time. Chance level is 50%, shown in gray. B, The change in detection of a Gabor patch presented within the blind field averaged across all contrast values. The lines marked in green are participants who performed at ceiling on the high contrast stimuli before starting training. C, D, Performance on the contrast detection task at each contrast level; C includes all participants, whereas D excludes the two participants who performed at ceiling before training. E, Detection of moving dots presented within the blind field. F, G, Shows the ability to discriminate between horizontally and vertically moving dots. In each case, red data points represent behavioral performance after visual training, and blue is performance before the start of training.
Figure 4.
Figure 4.
Increase in activity in area V5/hMT to the contrast stimulus averaged across all conditions in the blind field after training, compared with before training. A, Although there is an increase in activity in the damaged hemisphere to stimuli presented in the blind hemifield, there is also a decrease in response in that hemisphere to stimuli presented in the sighted field, that is, a decrease in ipsilateral activity after training (B). Mixed effects analysis, p < 0.001 uncorrected for a priori regions of interest in the occipital lobe, elsewhere cluster corrected p < 0.01.
Figure 5.
Figure 5.
A, The percentage of BOLD signal across all contrast values measured in anatomically defined V5/hMT in the lesion side of the brain before (blue) and after (red) training for stimuli in the blind hemifield. Almost all participants showed an increase, showed by the individual paired data points. B, The response in the same visual area to ipsilateral stimulation (presented in the sighted field), which showed no difference before and after training. C, The definition of V5/hMT based on Kolster et al., (2010). D, E, When the BOLD data were divided into the different contrast values, there was a significant effect of training in the lesion side V5/hMT (D) but not for the sighted hemifield, measured in the healthy hemisphere (E). F, The correlation between the baseline BOLD activity averaged across all contrast levels in lesion side V5/hMT and change in contrast detection performance. Only the five participants not at ceiling pretraining are included, and this small sample shows a significant correlation (Spearman's r = 0.90; p = 0.04). No such correlation was present between the change in BOLD signal with training and the change in contrast detection performance (G).
Figure 6.
Figure 6.
A, The Humphrey perimetry mean deviation pretraining and post-training for the entire blind hemifield, the points lying within the trained region, and a control area outside the trained regions. B, The correlation between the baseline percentage of the BOLD signal in V5/hMT and change in visual field within the trained region. C, shows the correlation between the change in contrast detection performance and change in visual field sensitivity within the trained region for the five participants not at ceiling at baseline testing.
Figure 7.
Figure 7.
A shows the overlap of the lesions across the seven participants. Only one extends close to the white matter of V5/hMT, with most concentrated around the calcarine sulcus. B, The strong inverse relationship between amount of improvement in the speed discrimination task before and after training and lesion size. C, Relationship between the baseline V5/hMT BOLD signal and lesion size. Each participant is identified by color. D, Increase in gray matter between pretraining and post-training sessions. This was restricted to the hippocampus in the trained hemisphere with no change in gray matter in the occipital cortex on the trained side.

Comment in

References

    1. Ajina S, Bridge H (2018) Blindsight relies on a functional connection between hMT+ and the lateral geniculate nucleus, not the pulvinar. PLoS Biol 16:e2005769. 10.1371/journal.pbio.2005769 - DOI - PMC - PubMed
    1. Ajina S, Kennard C, Rees G, Bridge H (2015a) Motion area V5/MT+ response to global motion in the absence of V1 resembles early visual cortex. Brain 138:164–178. 10.1093/brain/awu328 - DOI - PMC - PubMed
    1. Ajina S, Rees G, Kennard C, Bridge H (2015b) Abnormal contrast responses in the extrastriate cortex of blindsight patients. J Neurosci 35:8201–8213. 10.1523/JNEUROSCI.3075-14.2015 - DOI - PMC - PubMed
    1. Ajina S, Pestilli F, Rokem A, Kennard C, Bridge H (2015c) Human blindsight is mediated by an intact geniculo-extrastriate pathway. Elife 4 e08935. 10.7554/eLife.08935 - DOI - PMC - PubMed
    1. Andersson JL, Jenkinson M, Smith S (2007) Non-linear optimisation: FMRIB technical report. Oxford, United Kingdom: FMRIB TR07JA1.

LinkOut - more resources