. 2021 May 25;27(8):920-932.
doi: 10.1261/rna.078827.121. Online ahead of print.

Fusion protein EWS-FLI1 is incorporated into a protein granule in cells

Affiliations

Fusion protein EWS-FLI1 is incorporated into a protein granule in cells

Nasiha S Ahmed et al. RNA. .

Abstract

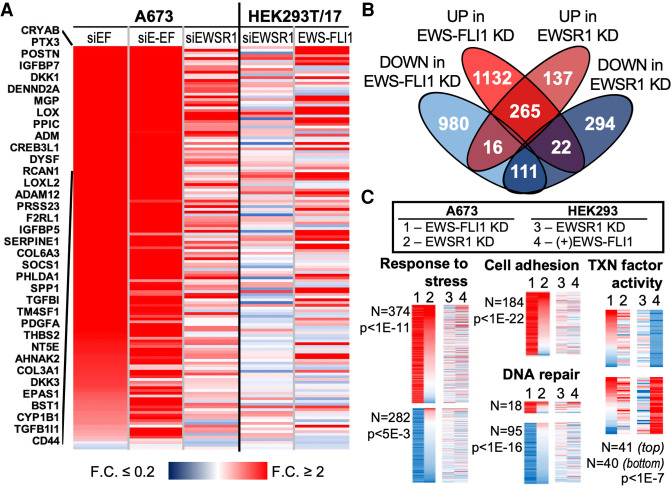
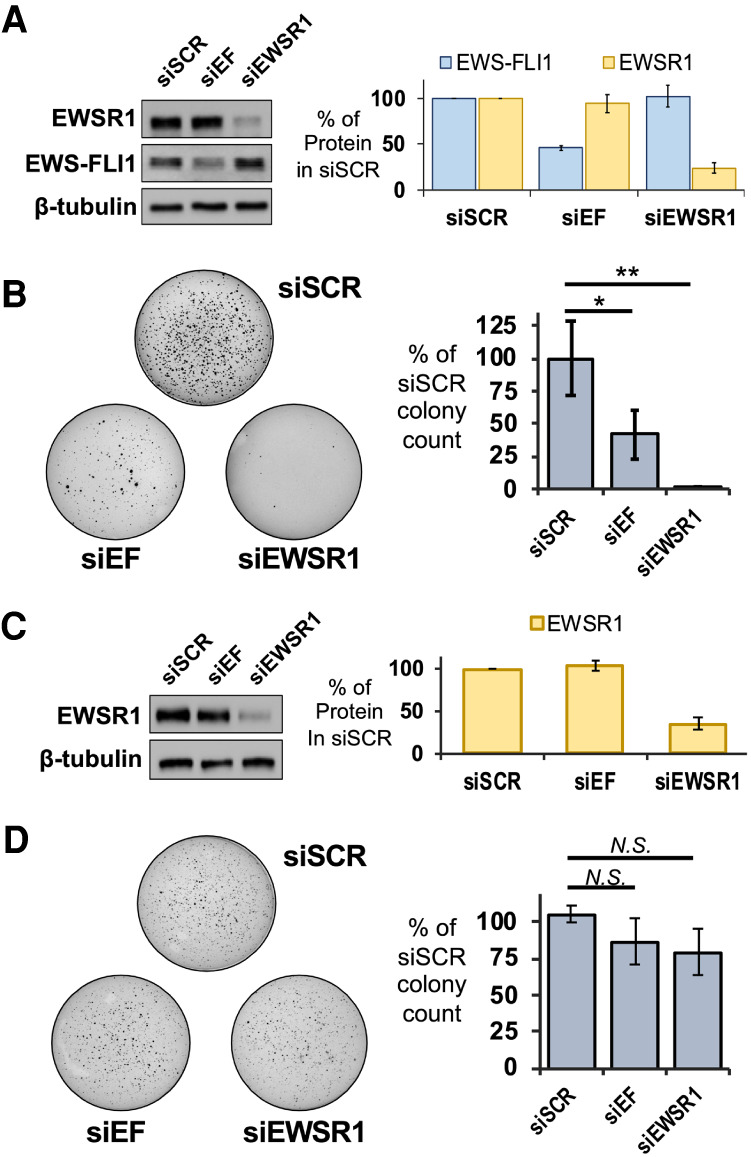
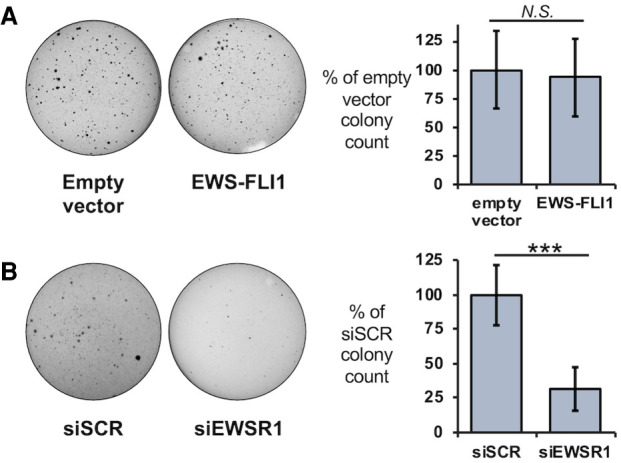
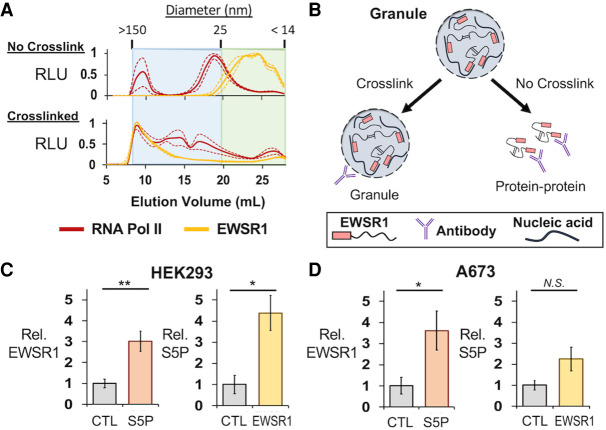
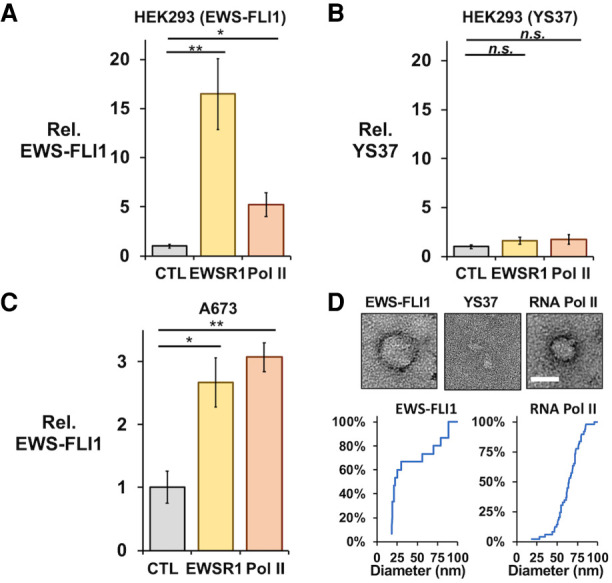
Ewing sarcoma is driven by fusion proteins containing a low complexity (LC) domain that is intrinsically disordered and a powerful transcriptional regulator. The most common fusion protein found in Ewing sarcoma, EWS-FLI1, takes its LC domain from the RNA-binding protein EWSR1 (Ewing Sarcoma RNA-binding protein 1) and a DNA-binding domain from the transcription factor FLI1 (Friend Leukemia Virus Integration 1). EWS-FLI1 can bind RNA polymerase II (RNA Pol II) and self-assemble through its low-complexity (LC) domain. The ability of RNA-binding proteins like EWSR1 to self-assemble or phase separate in cells has raised questions about the contribution of this process to EWS-FLI1 activity. We examined EWSR1 and EWS-FLI1 activity in Ewing sarcoma cells by siRNA-mediated knockdown and RNA-seq analysis. More transcripts were affected by the EWSR1 knockdown than expected and these included many EWS-FLI1 regulated genes. We reevaluated physical interactions between EWS-FLI1, EWSR1, and RNA Pol II, and employed a cross-linking based strategy to investigate protein assemblies associated with the proteins. The LC domain of EWS-FLI1 was required for the assemblies observed to form in cells. These results offer new insights into a protein assembly that may enable EWS-FLI1 to bind its wide network of protein partners and contribute to regulation of gene expression in Ewing sarcoma.

Keywords: Ewing sarcoma; fusion proteins; granules; phase separation; transcription.


Figures

FIGURE 1.
FIGURE 1.
Many transcripts are similarly affected by knockdown of EWS-FLI1 or EWSR1 in Ewing sarcoma. (A) A heat map shows fold changes for the 147 signature genes repressed by EWS-FLI1 in A673 cells. Results are sorted according to change in the siEF treatment, with names of the 39 most affected genes shown. Changes to mRNA levels in HEK293T/17 after knockdown by siEWSR1 or expression of EWS-FLI1 in HEK293T/17 cells are also shown. (B) The Venn diagram shows overlaps in transcripts increased or decreased by the knockdown (KD) of EWS-FLI1 or EWSR1 in A673 cells. The threshold required for increased or decreased transcripts was 1.6-fold change and adjusted P-value, P-adj < 0.05. (C) Heat maps show changes in transcript abundances in A673 after EWS-FLI1 (1) or EWSR1 (2) knockdown or in HEK293T/17 after EWSR1 knockdown (3) or EWS-FLI1 (4) expression. Included genes were taken from selected GO associations identified among those affected by the EWS-FLI1 knockdown: response to stress (GO:0006950), cell adhesion (GO:0007155), and DNA repair (GO:0006281). These are sorted by changes from EWS-FLI1 (1), then EWSR1 (2) knockdown. Changes of genes associated with transcription factor activity (GO:0003700) are shown for those affected by exogenous EWS-FLI1 in HEK293T/17 cells. The number of genes plotted is indicated and adjusted P-values corrected by the Benjamini and Hochberg false discovery rate.
FIGURE 2.
FIGURE 2.
Loss of EWSR1 inhibits anchorage-independent growth in Ewing sarcoma cells. (A, left) Western assays reveal knockdown for EWSR1 or EWS-FLI1 in A673 cells for treatment with siSCR, siEF, or siEWSR1. (Right) Averaged levels of protein were determined by densitometry relative to siSCR treatments (n = 3). (B, left) Soft agar assays were performed with A673 cells treated with siSCR, siEF, or siEWSR1. (Right) Colonies were counted to reveal reductions in averaged values relative to siSCR treatment (n = 3). (C, left) Western assays reveal knockdown for EWSR1 or EWS-FLI1 in HEK293T/17 cells for treatment with siSCR, siEF, or siEWSR1. (Right) Averaged levels of protein were determined by densitometry relative to siSCR treatments (n = 4). (D, left) Soft agar assays were performed for HEK293T/17 cells treated with siSCR, siEF, or siEWSR1. (Right) Colonies were counted to reveal no change in averaged values relative to siSCR treatment (n = 4). All error bars represent standard deviation. Student's t-test was calculated assuming equal variances: (**) P < 0.01; (*) P < 0.05; n.s., not significant (P > 0.05).
FIGURE 3.
FIGURE 3.
EWS-FLI1 can alter effects on cell growth for an EWSR1 knockdown. (A, left) Growth on soft agar was assessed for HEK293T/17 cells after transfection of empty plasmids or a plasmid expressing V5-EWS-FLI1. (Right) Colonies were counted to reveal no change in averaged values relative to siSCR treatment (n = 4). (B, left) Soft agar assays were performed with HEK293T/17 cells expressing V5-EWS-FLI1 and cotransfected with siSCR or siEWSR1 (n = 6). (Right) Colonies were counted to reveal a reduction in averaged values relative to siSCR treatment. Error bars represent standard deviation. Student's t-test was calculated for assuming equal variances: (***) P < 0.001.
FIGURE 4.
FIGURE 4.
EWSR1 and RNA Pol II are assembled in large protein assemblies. (A) Total protein from HEK293T/17 cell lysates was analyzed by SEC to separate proteins, complexes, or assemblies by size. The averaged ELISA signals are shown normalized to their maximum values for EWSR1 (C-9 antibody), yellow, or RNA Pol II (CTD4H8 antibody), red, as measured by ELISA. For samples from cells not crosslinked, top, RNA Pol II signals were highest in fractions eluting just before 20 mL, corresponding to particles of 25 nm in size. EWSR1 eluted after 20 mL or as a particle <25 nm in size. For crosslinked samples, bottom, the elution of EWSR1 and RNA Pol II shifted to early fractions with particles measured to be up to 150 nm in diameter. Dashed lines represent standard error about the mean (n = 3). (B) IP assays using cells without crosslinking enrich for ordinary and stable molecular complexes. Those using crosslinked cells can recover large molecular assemblies that form by weak protein interactions. (C, left) ELISA assays detected EWSR1 eluted from crosslinked IP assays of phosphorylated (S5P) RNA Pol II (Abcam, ab5131) in HEK293T/17 cells (n = 3). (Right) S5P RNA Pol II was detected for crosslinked IP of EWSR1 (B-1 antibody) (n = 3). (D, left) ELISA assays in A673 cells also detected EWSR1 eluted with S5P RNA Pol II. (Right) S5P RNA Pol II was detected in crosslinked IP assays of EWSR1 (n = 3). All error bars represent standard error about the mean. (AU) Absorbance units, (RLU) relative luminescence units. Student's t-test was calculated assuming equal variances: (**) P < 0.01; (*) P < 0.05; n.s., not significant (P > 0.05).
FIGURE 5.
FIGURE 5.
EWS-FLI1 and RNA Pol II coimmunoprecipitate in crosslinked protein granules. ELISA assays using an antibody to FLI1 measured interactions with FLI1-fusion proteins recovered by co-IP assays from crosslinked cells. The IP of EWSR1 (B-1) or RNA Pol II (CTD4H8) recovered V5-EWS-FLI1 (A) but not YS37 (B) protein expressed in HEK293T/17 cells by plasmid transfections (n = 3 each). (C) Crosslinked IP assays of EWSR1 and RNA Pol II also recovered endogenous EWS-FLI1 from A673 cells (n = 4). (D) Transmission electron microscopy detected protein particles recovered from crosslinked HEK293T/17 cells by IP of EWS-FLI1 (anti-FLI1 antibody, left) and RNA Pol II (CTD4H8, left), but not of YS37 (anti-FLI1 antibody, center). Scale bar inset represents 50 nm. Cumulative plots show diameters for particles imaged in IP samples for EWS-FLI1 (n = 24) or RNA Pol II (n = 77). All error bars represent standard error about the mean. Student's t-test was calculated assuming equal variances: (**) P < 0.01; (*) P < 0.05; n.s., not significant (P > 0.05).

Similar articles

Cited by

References

    1. Abraham KJ, Khosraviani N, Chan JNY, Gorthi A, Samman A, Zhao DY, Wang M, Bokros M, Vidya E, Ostrowski LA, et al. 2020. Nucleolar RNA polymerase II drives ribosome biogenesis. Nature 585: 298–302. 10.1038/s41586-020-2497-0 - DOI - PMC - PubMed
    1. Boulay G, Sandoval GJ, Riggi N, Iyer S, Buisson R, Naigles B, Awad ME, Rengarajan S, Volorio A, McBride MJ, et al. 2017. Cancer-specific retargeting of BAF complexes by a prion-like domain. Cell 171: 163–178.e19. 10.1016/j.cell.2017.07.036 - DOI - PMC - PubMed
    1. Chaturvedi A, Hoffman LM, Welm AL, Lessnick SL, Beckerle MC. 2012. The EWS/FLI oncogene drives changes in cellular morphology, adhesion, and migration in Ewing sarcoma. Genes Cancer 3: 102–116. 10.1177/1947601912457024 - DOI - PMC - PubMed
    1. Chi B, O'Connell JD, Yamazaki T, Gangopadhyay J, Gygi SP, Reed R. 2018. Interactome analyses revealed that the U1 snRNP machinery overlaps extensively with the RNAP II machinery and contains multiple ALS/SMA-causative proteins. Sci Rep 8: 8755. 10.1038/s41598-018-27136-3 - DOI - PMC - PubMed
    1. Chong S, Dugast-Darzacq C, Liu Z, Dong P, Dailey GM, Cattoglio C, Heckert A, Banala S, Lavis L, Darzacq X, et al. 2018. Imaging dynamic and selective low-complexity domain interactions that control gene transcription. Science 361: eaar2555. 10.1126/science.aar2555 - DOI - PMC - PubMed