. 2021 Jul 9;373(6551):eabi5273.
doi: 10.1126/science.abi5273. Epub 2021 May 25.

Estimating infectiousness throughout SARS-CoV-2 infection course

Affiliations

Estimating infectiousness throughout SARS-CoV-2 infection course

Terry C Jones et al. Science. .

Abstract

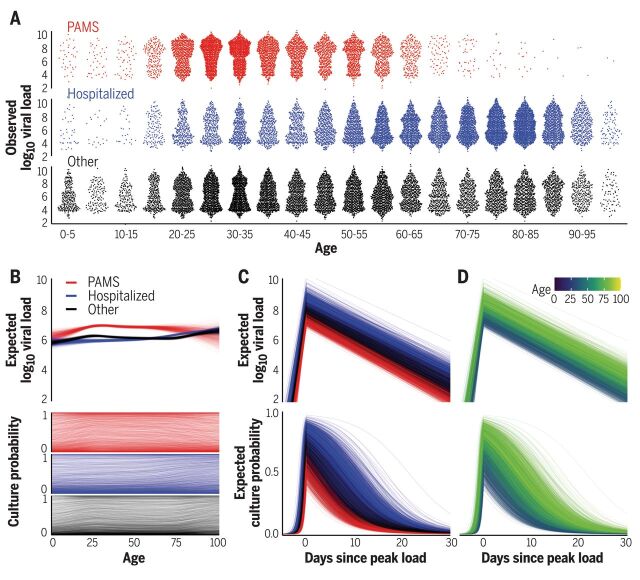
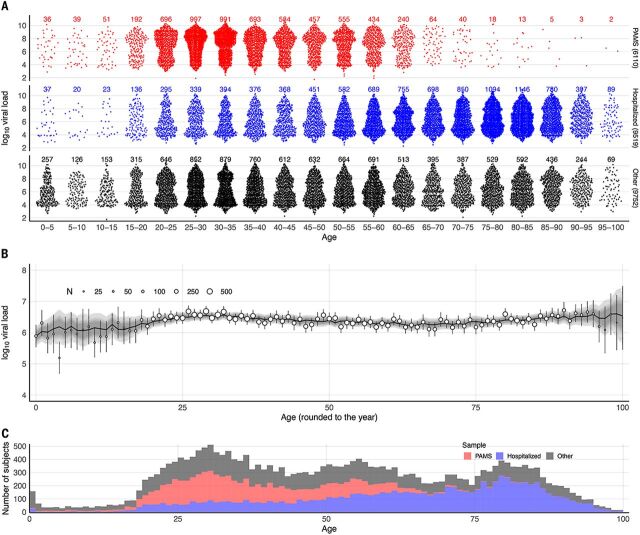
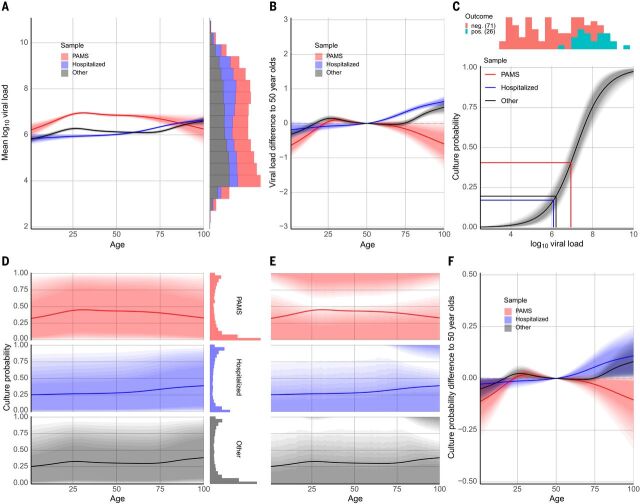
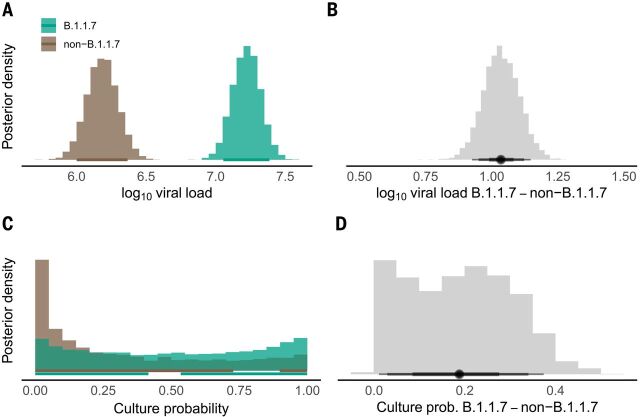
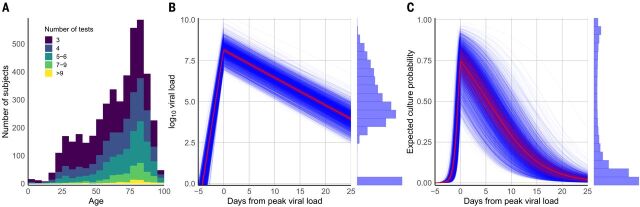
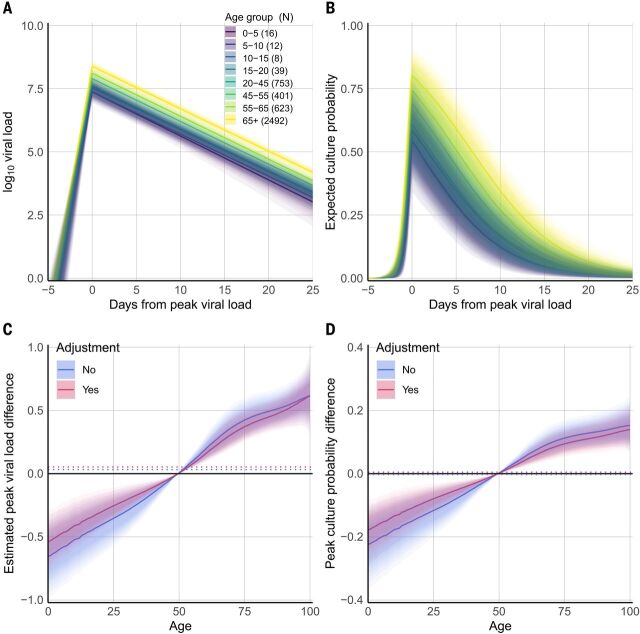
Two elementary parameters for quantifying viral infection and shedding are viral load and whether samples yield a replicating virus isolate in cell culture. We examined 25,381 cases of severe acute respiratory syndrome coronavirus 2 (SARS-CoV-2) in Germany, including 6110 from test centers attended by presymptomatic, asymptomatic, and mildly symptomatic (PAMS) subjects, 9519 who were hospitalized, and 1533 B.1.1.7 lineage infections. The viral load of the youngest subjects was lower than that of the older subjects by 0.5 (or fewer) log10 units, and they displayed an estimated ~78% of the peak cell culture replication probability; in part this was due to smaller swab sizes and unlikely to be clinically relevant. Viral loads above 109 copies per swab were found in 8% of subjects, one-third of whom were PAMS, with a mean age of 37.6 years. We estimate 4.3 days from onset of shedding to peak viral load (108.1 RNA copies per swab) and peak cell culture isolation probability (0.75). B.1.1.7 subjects had mean log10 viral load 1.05 higher than that of non-B.1.1.7 subjects, and the estimated cell culture replication probability of B.1.1.7 subjects was higher by a factor of 2.6.


Figures

None
Viral load and cell culture infectivity in 25,381 SARS-CoV-2 infections.
(A) Viral loads in presymptomatic, asymptomatic, and mildly symptomatic cases (PAMS; red), hospitalized patients (blue), and other subjects (black). (B) Expected first-positive viral load and cell culture isolation probability, colored as in (A). (C) Temporal estimation with lines representing patients, colored as in (A). (D) As in (C), but colored by age.
Fig. 1
Fig. 1. Distribution of age and first-positive viral load in PAMS, Hospitalized, and Other subjects.
(A) Distribution of observed first-positive viral loads for 25,381 subjects according to clinical status (6110 PAMS, 9519 Hospitalized, 9752 Other) and age group. (B) Age–viral load association. Observed viral loads are shown as circles (circle size indicates subject count) with vertical lines denoting confidence intervals; model-predicted viral loads are shown as a black, roughly horizontal line, with gray shading denoting credible intervals. (C) Stacked age histograms according to subject clinical status. Because inclusion in the study required a positive RT-PCR test result, and because testing is in many cases symptom-dependent, the study may have a proportion of PAMS cases that differs from the proportion in the general population.
Fig. 2
Fig. 2. Estimated viral load and culture probability at time of first positive RT-PCR test.
Shaded regions denote 90% credible intervals in all panels. To indicate change within each 90% region, shading decreases in intensity from a narrow 50% credibility interval level to the full 90%. (A) Estimated mean viral load in first-positive RT-PCR tests according to age and status. The stacked histogram (right) shows the observed viral load distribution. Because the shaded region shows the 90% credible interval for the mean, it does not include the higher values shown in the histogram on the right. (B) Differences in estimated first-positive viral load according to age and status. Each colored line is specific to a particular subset of subjects (PAMS, Hospitalized, Other). Each line shows how viral load differs by age for subjects of the corresponding status from that of 50-year-old (rounded age) subjects of the same status. The comparison against 50-year-olds avoids comparing any subset of the subjects against a value (such as the overall mean) that is computed in part on the basis of that subset, thereby partially comparing data to the same data. The mean first-positive viral loads for 50-year-old PAMS and Hospitalized subjects are 7.2 and 6.2, respectively, allowing relative y-axis differences to be translated to approximate viral loads. (C) Estimation of the association between viral load and cell culture isolation success rate based on data from our own laboratory (19) and Perera et al. (20). Viral load differences in the log10 range ~6 to ~9 have a large impact on culture probability, whereas the impact is negligible for differences outside that range. The vertical lines indicate the observed mean first-positive viral loads for different subject groups; the horizontal lines show the corresponding expected probabilities of a positive culture. (D) Estimated culture probability at time of first-positive RT-PCR according to age and status, obtained by combining the results in (A) and (C). Culture probability is calculated from posterior predictions [i.e., the posterior means shown in (A) plus error variance]. The histogram at right shows that mean culture probabilities calculated from observed viral loads are not well matched by credible intervals, which do not include the most probable estimated culture probabilities. (E) Culture probability with highest–posterior density regions, which do include the most probable estimated culture probabilities and match the histograms in (D) well. The y axis is the same as in (D). (F) Differences of estimated expected culture probability at time of first-positive RT-PCR for age groups, with plot elements as described for (B).
Fig. 3
Fig. 3. Posterior distributions of estimated viral loads and culture probabilities for B.1.1.7 and non-B.1.1.7 subjects, and their differences.
Viral loads and estimated culture probabilities of 1387 B.1.1.7 subjects and 977 non-B.1.1.7 subjects are represented. To select a comparable subset of non-B.1.1.7 viral loads for the comparison, we included only non-B.1.1.7 subjects from test centers that had detected a B.1.1.7 variant as well as at least one non-B.1.1.7 subject, and only if the non-B.1.1.7 infection was detected on the same day as a B.1.1.7 infection was detected, plus or minus 1 day. Similar differences exist when viral loads from larger, less restrictive, subsets of non-B.1.1.7 subjects are used in the comparison (table S2; see materials and methods). (A) Posterior distribution of viral load. (B) Posterior distribution of difference of average viral load between B.1.1.7 and non-B.1.1.7 cases. (C) Posterior distribution of the estimated culture probability. See also fig. S2. (D) Difference of mean culture probability between B.1.1.7 and non-B.1.1.7 cases. Horizontal lines indicate 90% credible intervals in (A), (B), and (D) and the highest posterior density intervals in (C).
Fig. 4
Fig. 4. Viral load and estimated infectious virus shedding time series.
Of 25,381 positive subjects, 4344 had three or more RT-PCR test results available, and these were used in a viral load time-series analysis. Subjects with only one result cannot be placed in time because of inherent ambiguity (given that the model has both an increasing and a decreasing phase), and those with only two test results are excluded from the time-series analysis because of insufficient data for temporal placement (their number of data points is less than the number of model parameters being estimated). (A) Number of subjects with three or more RT-PCR test results available, at least two of which were positive, according to age. (B) Estimated time course of viral load for 18,136 RT-PCR results from the 4344 subjects with at least three RT-PCR results. Blue lines are expected complete time courses for individual cases. The sample mean is shown in red, with its 90% credible interval as a shaded area. The histogram at right shows the distribution of all observed viral loads. The histogram values at zero correspond to the initial and trailing negative tests in subject timelines. Figure S8 shows raw viral load time series, per subject and split by number of RT-PCR tests. (C) Estimated time course of positive cell culture probability, calculated by applying the results shown in Fig. 2C to the estimated viral load time courses in (B). Blue lines are expected time courses for individual subjects. The sample average is shown in red, with its 90% credible interval as a shaded area. The histogram at right shows the distribution of culture probabilities in the sample and was obtained by applying the curve in Fig. 2C to the data in the histogram in (B).
Fig. 5
Fig. 5. Estimated expected viral load and culture probability for age groups by time.
(A) Change in estimated viral load over time according to age group for 4344 subjects with at least three RT-PCR tests, at least two of which were positive. Shading indicates the 90% credible interval of the mean. (B) Change in estimated culture probability over time according to age. Age groups, coloring, and shading are as in (A). (C) Estimated age group differences in mean peak viral load, corresponding to the values at day zero in (A). (D) Estimated age group differences in mean peak culture probability, corresponding to the values at day zero in (B). In (C) and (D), adjusted differences account for variations by age in clinical status and gender. Dotted lines indicate grand means for the 4344 subjects.

Similar articles

Cited by

References

    1. Lee S., Kim T., Lee E., Lee C., Kim H., Rhee H., Park S. Y., Son H.-J., Yu S., Park J. W., Choo E. J., Park S., Loeb M., Kim T. H., Clinical Course and Molecular Viral Shedding Among Asymptomatic and Symptomatic Patients With SARS-CoV-2 Infection in a Community Treatment Center in the Republic of Korea. JAMA Intern. Med. 180, 1447–1452 (2020). 10.1001/jamainternmed.2020.3862 - DOI - PMC - PubMed
    1. Szablewski C. M., Chang K. T., Brown M. M., Chu V. T., Yousaf A. R., Anyalechi N., Aryee P. A., Kirking H. L., Lumsden M., Mayweather E., McDaniel C. J., Montierth R., Mohammed A., Schwartz N. G., Shah J. A., Tate J. E., Dirlikov E., Drenzek C., Lanzieri T. M., Stewart R. J., SARS-CoV-2 Transmission and Infection Among Attendees of an Overnight Camp - Georgia, June 2020. MMWR Morb. Mortal. Wkly. Rep. 69, 1023–1025 (2020). 10.15585/mmwr.mm6931e1 - DOI - PMC - PubMed
    1. Long Q.-X., Tang X.-J., Shi Q.-L., Li Q., Deng H.-J., Yuan J., Hu J.-L., Xu W., Zhang Y., Lv F.-J., Su K., Zhang F., Gong J., Wu B., Liu X.-M., Li J.-J., Qiu J.-F., Chen J., Huang A.-L., Clinical and immunological assessment of asymptomatic SARS-CoV-2 infections. Nat. Med. 26, 1200–1204 (2020). 10.1038/s41591-020-0965-6 - DOI - PubMed
    1. Bi Q., Wu Y., Mei S., Ye C., Zou X., Zhang Z., Liu X., Wei L., Truelove S. A., Zhang T., Gao W., Cheng C., Tang X., Wu X., Wu Y., Sun B., Huang S., Sun Y., Zhang J., Ma T., Lessler J., Feng T., Epidemiology and transmission of COVID-19 in 391 cases and 1286 of their close contacts in Shenzhen, China: A retrospective cohort study. Lancet Infect. Dis. 20, 911–919 (2020). 10.1016/S1473-3099(20)30287-5 - DOI - PMC - PubMed
    1. Waterfield T., Watson C., Moore R., Ferris K., Tonry C., Watt A., McGinn C., Foster S., Evans J., Lyttle M. D., Ahmad S., Ladhani S., Corr M., McFetridge L., Mitchell H., Brown K., Amirthalingam G., Maney J.-A., Christie S., Seroprevalence of SARS-CoV-2 antibodies in children: A prospective multicentre cohort study. Arch. Dis. Child. 10.1136/archdischild-2020-320558 (2020). 10.1136/archdischild-2020-320558 - DOI - PubMed

Publication types

MeSH terms