. 2021 May 25;12(1):2765.
doi: 10.1038/s41467-021-23014-1.

Longitudinal analysis of blood markers reveals progressive loss of resilience and predicts human lifespan limit

Affiliations

Longitudinal analysis of blood markers reveals progressive loss of resilience and predicts human lifespan limit

Timothy V Pyrkov et al. Nat Commun. .

Abstract

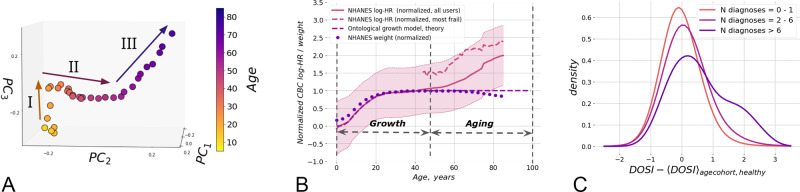
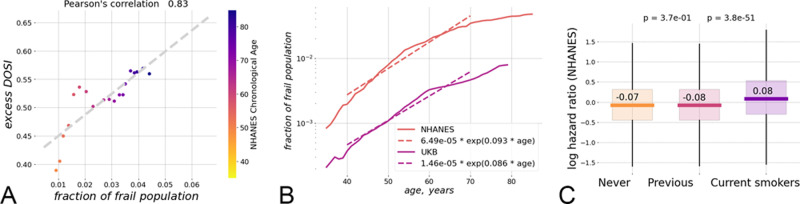
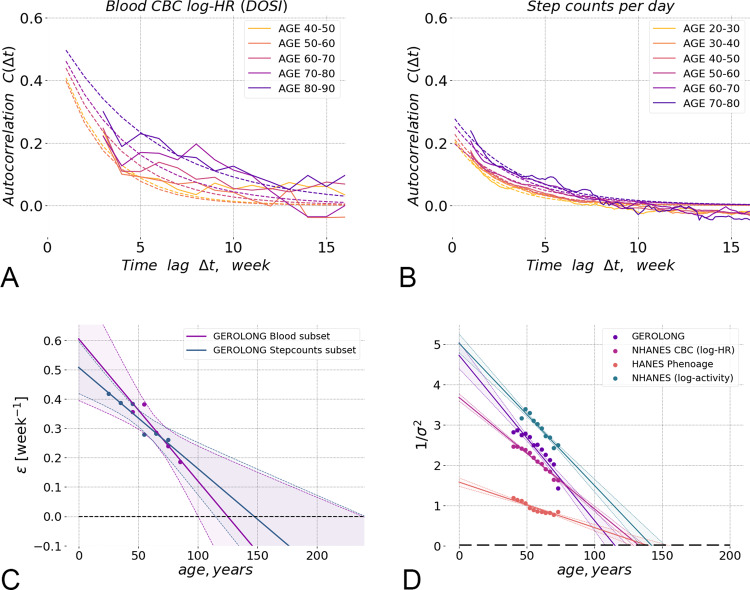
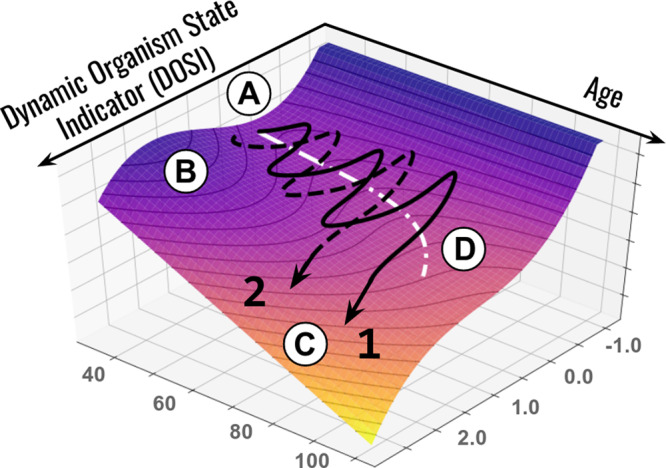
We investigated the dynamic properties of the organism state fluctuations along individual aging trajectories in a large longitudinal database of CBC measurements from a consumer diagnostics laboratory. To simplify the analysis, we used a log-linear mortality estimate from the CBC variables as a single quantitative measure of the aging process, henceforth referred to as dynamic organism state indicator (DOSI). We observed, that the age-dependent population DOSI distribution broadening could be explained by a progressive loss of physiological resilience measured by the DOSI auto-correlation time. Extrapolation of this trend suggested that DOSI recovery time and variance would simultaneously diverge at a critical point of 120 - 150 years of age corresponding to a complete loss of resilience. The observation was immediately confirmed by the independent analysis of correlation properties of intraday physical activity levels fluctuations collected by wearable devices. We conclude that the criticality resulting in the end of life is an intrinsic biological property of an organism that is independent of stress factors and signifies a fundamental or absolute limit of human lifespan.


Conflict of interest statement

P.O.F. is a shareholder of Gero PTE. A.G. is a member of Gero PTE Advisory Board. T.V.P., A.E.T., K.A., L.I.M., and P.O.F. are employees of Gero PTE. The study was funded by Gero PTE.

Figures

Fig. 1
Fig. 1. Quantification of aging and development.
A The graphical representation of the PCA for 5–85 year old NHANES participants follows an age-cohort averaged aging trajectory. Centers of each sequential age cohort are plotted in first three PCs. Three approximately linear segments are clearly seen in aging trajectory, corresponding to (I) age < 35; (II) age 35–65; (III) age > 65. B Dynamic organism state indicator (DOSI) mean values (solid line) and variance (shaded area) are plotted relative to age for all participants of NHANES study. The average line demonstrates nearly linear growth after age of 40. In younger ages the dependence of age is different and consistent with the universal curve suggested by the general model for ontogenetic growth. To illustrate the general character of this early-life dependence we superimposed it with the curve of mean weight in age cohorts of the same population (dotted line). All values are plotted in normalized from as in. The average DOSI of the “most frail” (“compound morbidity index”, CMI > 0.6) individuals is shown with the dashed line. C Distributions of sex- and age-adjusted DOSI in cohorts of NHANES participants in different morbidity categories relative to the DOSI mean in cohorts of “non-frail” (1 or no diagnoses, CMI < 0.1) individuals. Note that the distribution function in the “most frail” group (more than six diagnoses, CMI > 0.6) exhibited the largest shift and a profound deviation from the symmetric form.
Fig. 2
Fig. 2. The relation between the dynamic organism state indicator (DOSI) and lifestyles, frailty, and health risks.
A Fraction of frail persons is strongly correlated with the excess DOSI levels, that is the difference between the DOSI of an individual and its average and the sex- and age-matched cohort in the “non-frail” population in NHANES. B Exponential fit showed that until the age of 70 y.o. the fraction of the “most frail” individuals in the population grows approximately exponentially with age with the doubling rate constants of 0.08 and 0.10 per year in the UKB and the NHANES cohorts, respectively. C Distribution of log-hazards ratio in age- and sex-matched cohorts of NHANES participants who never smoked, smoked previously but quit prior to the time of study participation, or were current smokers at the time of the study. The DOSI level is elevated for current smokers, while it is almost indistinguishable between never-smokers and those who quit smoking (two-sided Mann–Whitney test p > 0.05). Each boxplot shows the center (median) of the distribution, boxplot bounds show the 25 and 75% percentiles and boxplot whiskers show the 5 and 95% percentiles.
Fig. 3
Fig. 3. Physiological state fluctuations and loss of resilience.
A The auto-correlation function Ct) of the Dynamic organism state indicator (DOSI) fluctuations during several weeks averaged in sequential 10-year age-cohorts of GEROLONG subjects showed gradual age-related remodelling. Experimental data and fit to autocorrelation function are shown with solid and dashed lines, respectively. The DOSI correlations are lost over time Δt between the measurements and, hence, the DOSI deviations from its age norm reach the equilibrium distribution faster in younger individuals. B The auto-correlation function Ct) of fluctuations of the negative logaritm of steps-per-day during several weeks averaged in sequential 10-year age-cohorts of GEROLONG Stepcounts subset subjects showed similar gradual age-related remodelling. C The DOSI relaxation rate (or the inverse characteristic recovery time) computed for sequential age-matched cohorts from the GEROLONG dataset decreased approximately linearly with age and could be extrapolated to zero at an age in the range of ~110–170 y.o. (at this point, there is complete loss of resilience and, hence, loss of stability of the organism state). The solid lines and shaded areas show the line of linear regression fit and its 95% confidence interval. D The inverse variance of DOSI decreased linearly in all investigated datasets and its extrapolated value vanished (hence, the variance diverged) at an age in the range of 120–150 y.o. We performed the linear fit for subjects 40 y.o. and older, excluding the “most frail” (“compound morbidity index”, CMI > 0.6) individuals. The solid lines and shaded areas show the line of linear regression fit and its 95% confidence interval. The blue dots and lines show the inverse variance of log-scaled measure of total physical activity (the number of steps per day recorded by a wearable accelerometer) for NHANES participants. Phenoage, calculated using explicit age and additional blood biochemistry parameters also demonstrated age-related decrease of the inverse variance in NHANES population.
Fig. 4
Fig. 4. Schematic representation of loss of resilience along aging trajectories.
Representative aging trajectories are superimposed over the potential energy landscape (vertical axis) representing regulatory constraints. The stability basin (A) is separated from the unstable region (C) by the potential energy barrier (B). Aging leads to a gradual decrease in the activation energy and barrier curvature and an exponential increase in the probability of barrier crossing. The stochastic activation into a dynamically unstable (frail) state is associated with acquisition of multiple morbidities and certain death of an organism. The white dotted line (D) represents the trajectory of the attraction basin minimum. Examples 1 (black solid line) and 2 (black dashed line) represent individual life-long stochastic DOSI trajectories that differ with respect to the age of first chronic disease diagnosis.

Comment in

References

    1. Mitnitski A, Rockwood K. The rate of aging: the rate of deficit accumulation does not change over the adult life span. Biogerontology. 2016;17:199–204. doi: 10.1007/s10522-015-9583-y. - DOI - PubMed
    1. Yu R, Wu WC, Leung J, Hu SC, Woo J. Frailty and its contributory factors in older adults: a comparison of two asian regions (hong kong and taiwan) Int. J. Environ. Res. Public Health. 2017;14:1096. doi: 10.3390/ijerph14101096. - DOI - PMC - PubMed
    1. Aleksandr Z, et al. Identification of 12 genetic loci associated with human healthspan. Commun. Biol. 2019;2:1–11. doi: 10.1038/s42003-018-0242-0. - DOI - PMC - PubMed
    1. Podolskiy DI, Lobanov AV, Kryukov GV, Gladyshev VN. Analysis of cancer genomes reveals basic features of human aging and its role in cancer development. Nat. Commun. 2016;7:12157. doi: 10.1038/ncomms12157. - DOI - PMC - PubMed
    1. Niccoli T, Partridge L. Ageing as a risk factor for disease. Curr. Biol. 2012;22:R741–R752. doi: 10.1016/j.cub.2012.07.024. - DOI - PubMed