. 2021 May 25;12(1):3133.
doi: 10.1038/s41467-021-22843-4.

Decreased GLUT2 and glucose uptake contribute to insulin secretion defects in MODY3/HNF1A hiPSC-derived mutant β cells

Affiliations

Decreased GLUT2 and glucose uptake contribute to insulin secretion defects in MODY3/HNF1A hiPSC-derived mutant β cells

Blaise Su Jun Low et al. Nat Commun. .

Abstract

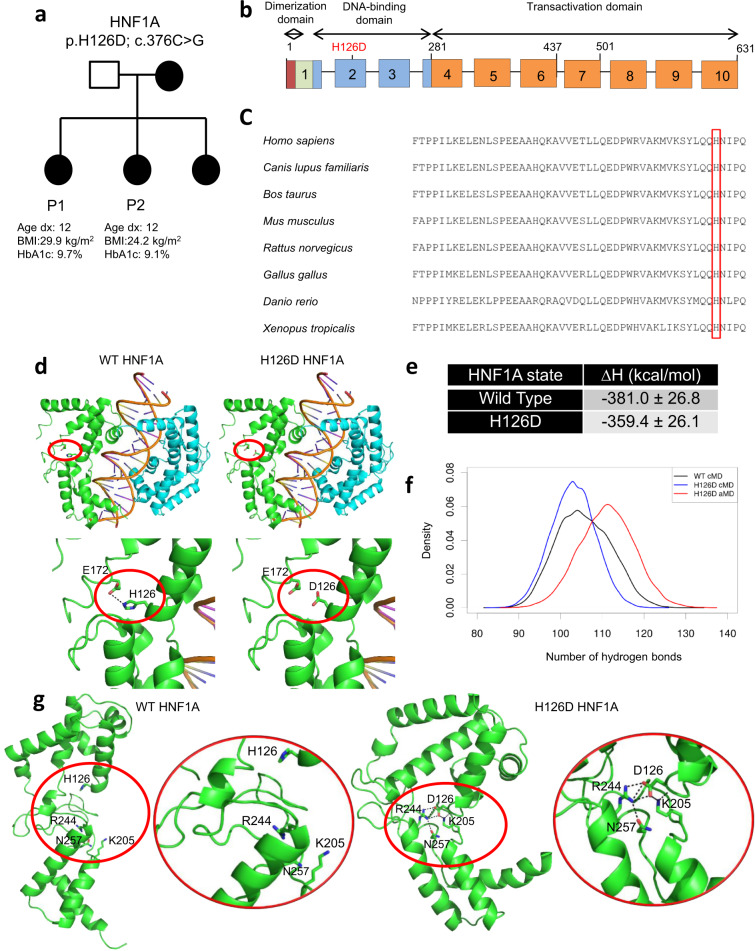
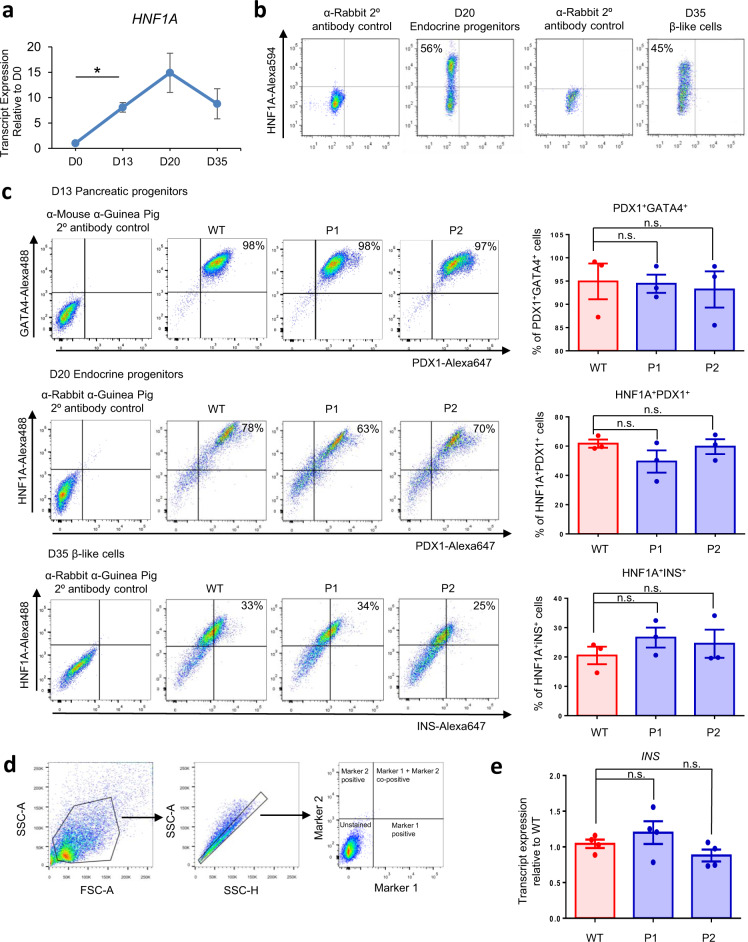
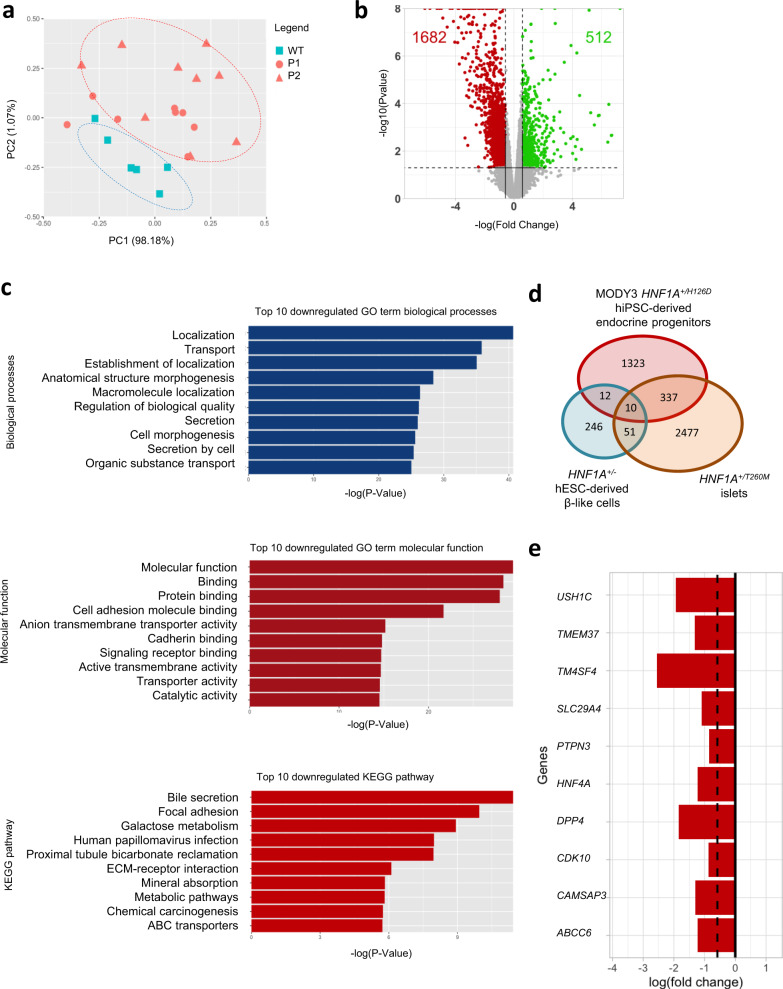
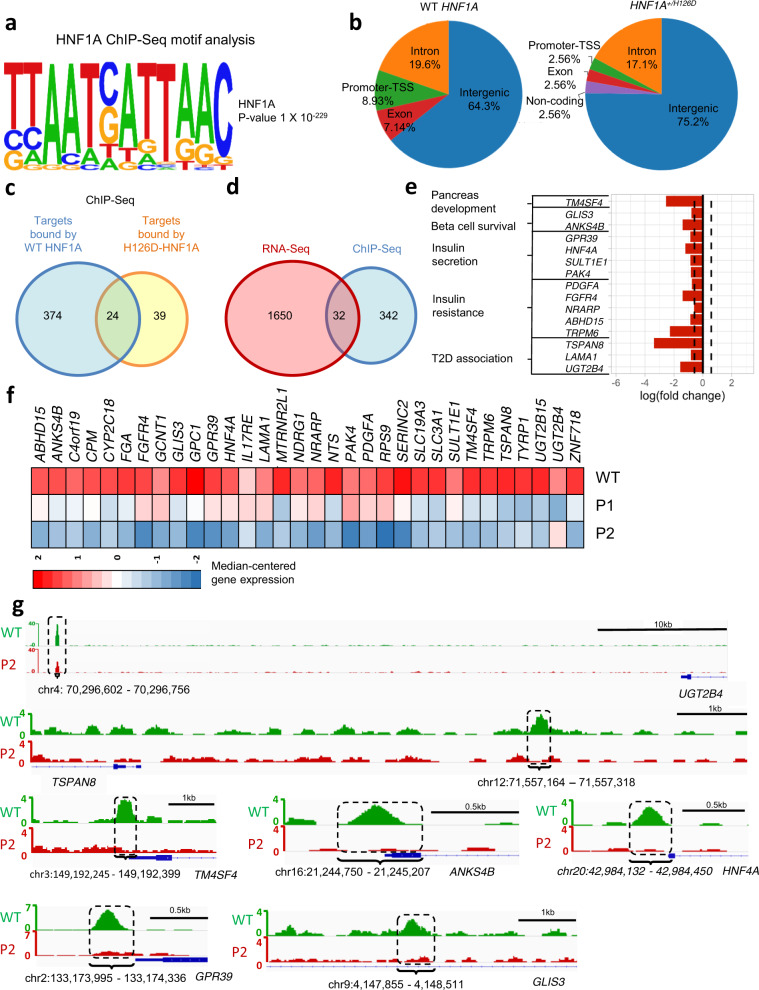
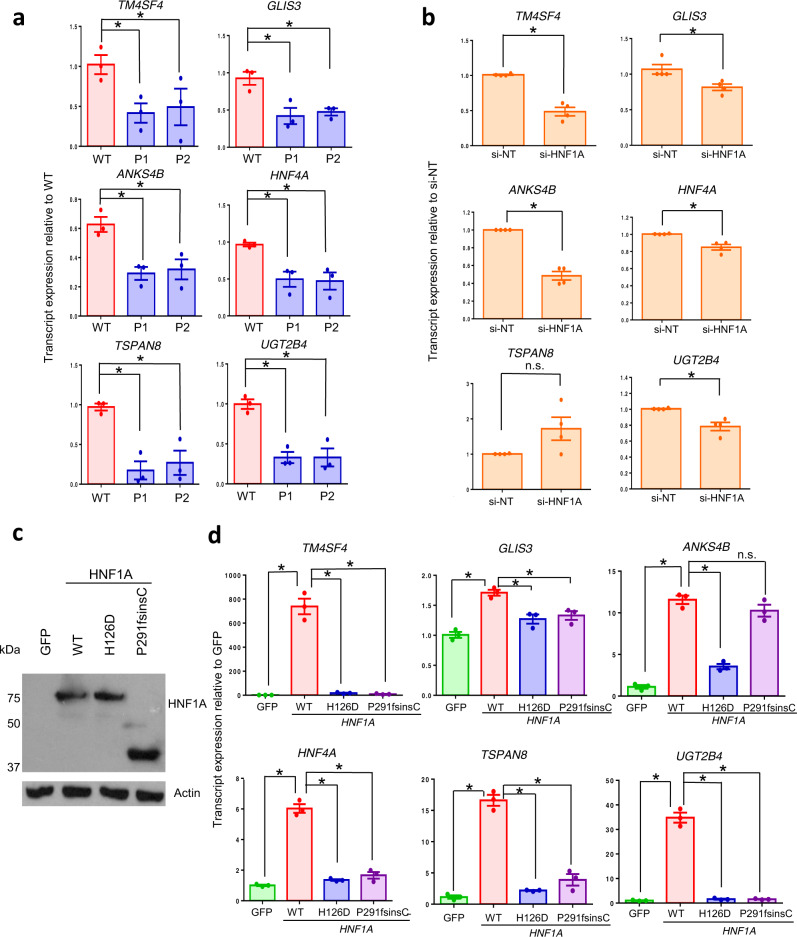
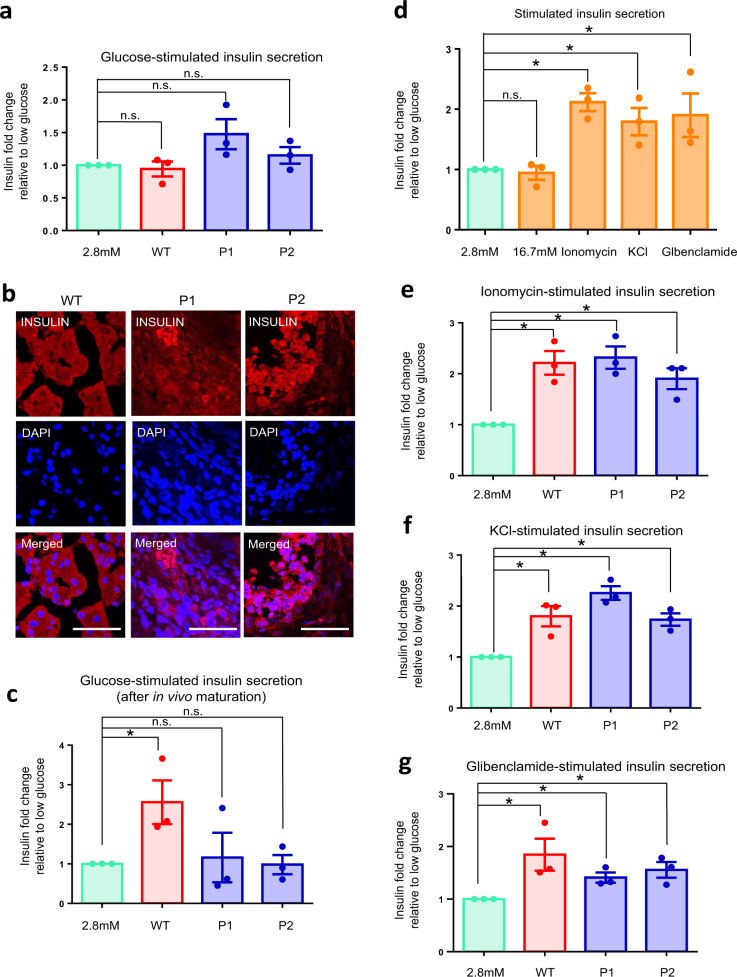
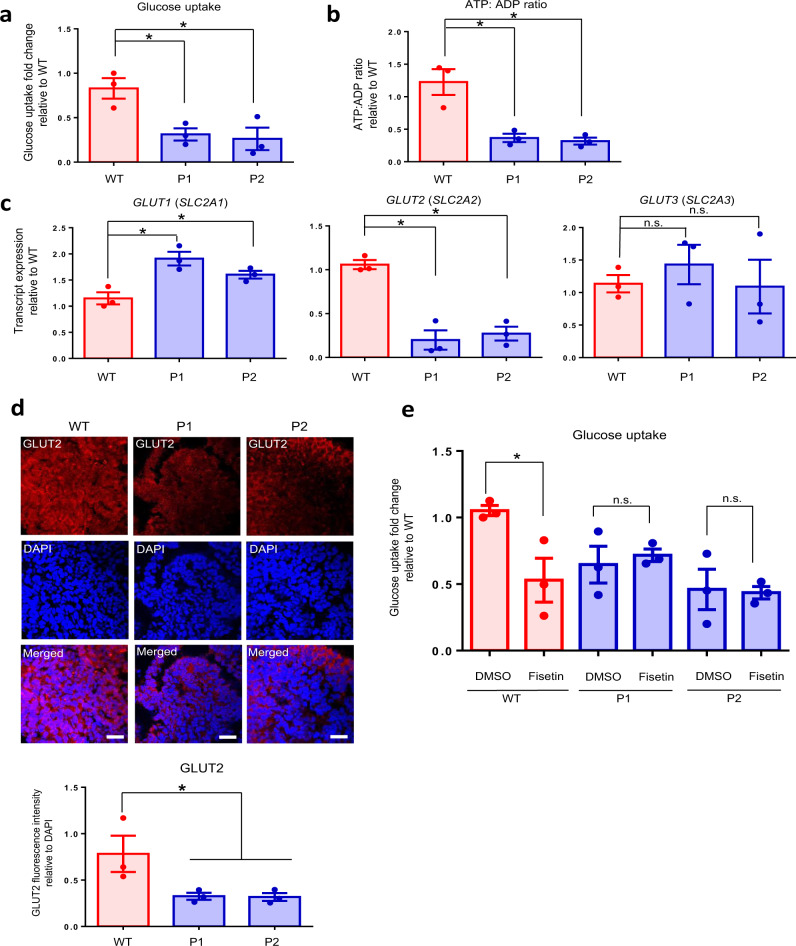
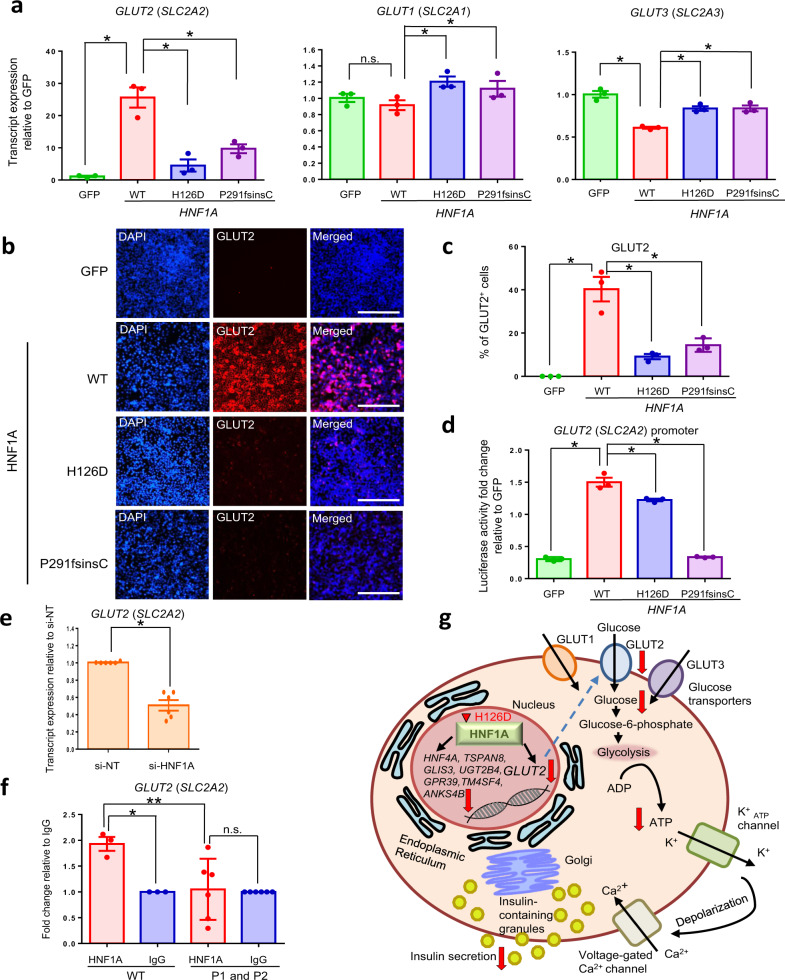
Heterozygous HNF1A gene mutations can cause maturity onset diabetes of the young 3 (MODY3), characterized by insulin secretion defects. However, specific mechanisms of MODY3 in humans remain unclear due to lack of access to diseased human pancreatic cells. Here, we utilize MODY3 patient-derived human induced pluripotent stem cells (hiPSCs) to study the effect(s) of a causal HNF1A+/H126D mutation on pancreatic function. Molecular dynamics simulations predict that the H126D mutation could compromise DNA binding and gene target transcription. Genome-wide RNA-Seq and ChIP-Seq analyses on MODY3 hiPSC-derived endocrine progenitors reveal numerous HNF1A gene targets affected by the mutation. We find decreased glucose transporter GLUT2 expression, which is associated with reduced glucose uptake and ATP production in the MODY3 hiPSC-derived β-like cells. Overall, our findings reveal the importance of HNF1A in regulating GLUT2 and several genes involved in insulin secretion that can account for the insulin secretory defect clinically observed in MODY3 patients.


Conflict of interest statement

N.H.J.N. and A.K.K.T. are co-founders of BetaLife Pte Ltd. C.S.V. is the co-founder of Sinopsee Therapeutics and Aplomex. The other authors declare no competing interests.

Figures

Fig. 1
Fig. 1. HNF1A H126D mutation alters amino acid interactions and HNF1A protein conformation.
a MODY3 family pedigree. Square denotes male, circles denote females. Solid circles denote diabetic individuals. BMI body mass index, HbA1c haemoglobin A1c. b HNF1A gene structure consists of three functional domains: dimerization domain (red), DNA-binding domain (blue) and transactivation domain (orange). H126D mutation occurs in the DNA-binding domain. c Multiple sequence alignment of HNF1A protein sequences amongst various species. H126 is highlighted in red box. d Structures of WT HNF1A (PDB 1IC8) and H126D mutant protein (green and cyan) bound to a gene promoter. Interactions between H126/D126 and E172 are highlighted in red circles. e Computed binding free energies (∆H) for formation of protein–DNA complexes for WT HNF1A and H126D mutant (entropy change was assumed to be the same for all complexes and therefore ignored). f Histogram of intramolecular hydrogen bond counts obtained from conventional molecular dynamics (cMD) simulations of WT (black) and mutant HNF1A H126D (blue) complexed with DNA, and accelerated molecular dynamics (aMD) simulations of H126D mutant HNF1A complexed with DNA (unweighted, red). A hydrogen bond is counted when the angle between the donor and acceptor heavy atoms is greater than or equal to 135° and their distance is less than or equal to 3.5 Å. g Representative trajectory structures obtained from the cMD simulations of WT and mutant H126D HNF1A. The insets (highlighted in red circles) show the interactions of H126 and D126 with neighboring residues. WT wild-type, P1 patient 1, P2 patient 2. “See also Supplementary Movies 1 and 2, and Fig. S1.” Source data are provided as a Source data file.
Fig. 2
Fig. 2. No differences in pancreatic differentiation efficiencies between WT and mutant cell lines.
a RT-qPCR analysis of HNF1A transcripts during various stages of pancreatic differentiation. n = 3 independent experiments; p = 0.0173. b Flow cytometry analysis of HNF1A protein expression in differentiated endocrine progenitors and β-like cells. c Flow cytometry analysis of GATA4 and PDX1 protein expression in D13 pancreatic progenitors, HNF1A and PDX1 in D20 endocrine progenitors and HNF1A and INS in D35 β-like cells in WT (red) and mutant (blue) cell lines. n = 3 independent experiments. d Gating strategy used for flow cytometry for gating hPSC-derived pancreatic cells across various linages. The same gating strategy was used for all flow cytometry experiments presented in this paper (Figs. 2b, 2c and S2f). e RT-qPCR analysis of INS transcripts in D35 β-like cells. n = 4 independent experiments. D day of differentiation. WT wild-type, P1 patient 1, P2 patient 2. RT-qPCR quantitative reverse transcription polymerase chain reaction. For all statistical analysis: Error bars represent standard error of mean (SEM). Unpaired one-tailed Student’s t-test was performed. Asterisk indicates P-value < 0.05. n.s. non-significant. “See also Fig. S3.” Source data are provided as a Source data file.
Fig. 3
Fig. 3. RNA-Seq analyses reveal a downregulation of genes involved in pancreatic endocrine and β cell function in MODY3 endocrine progenitors.
a Principal component analysis (PCA) plot of RNA-Seq data for WT and MODY3-hPSC-derived day 20 endocrine progenitors. Each dot in the PCA plot represents an independently sampled replicate of each cell line. All the dots represent: WT (blue square) = H9 (3 replicates), iAGb (3 replicates), P1 (red circle) = P1a (2 replicates), P1b (3 replicates), P1c (3 replicates), P2 (red triangle) = P2a (3 replicates), P2b (3 replicates), P2c (3 replicates). PC principal component. b Volcano plot depicting differential gene expression (False discovery rate < 0.05 and Fold change > ±1.5 fold) in WT and mutant endocrine progenitors. Red dots represent downregulated genes and green dots indicate upregulated genes in mutant endocrine progenitors. c Gene Ontology (GO) and Kyoto Encyclopaedia of Genes and Genome (KEGG) analyses of top ten downregulated biological processes, molecular functions and KEGG pathways in mutant endocrine progenitors. Unadjusted P-values were calculated using two-sided Mann-Whitney U test according to the GOSeq protocol. d Venn diagram depicting the number of genes that are downregulated in HNF1A+/H126D endocrine progenitors, HNF1A+/T260M islets and HNF1A+/− hESC-derived β-like cells. Overlaps show the number of common downregulated genes. e Common genes downregulated in HNF1A+/H126D endocrine progenitors, HNF1A+/T260M islets, and HNF1A+/− hESC-derived β-like cells. WT wild-type, P1 patient 1, P2 patient 2. hPSC human pluripotent stem cells. hESC human embryonic stem cells. “See also Fig. S5.”.
Fig. 4
Fig. 4. RNA-Seq and ChIP-Seq analyses reveal putative HNF1A targets affected by HNF1A+/H126D mutation.
a HNF1A consensus motif identified in our ChIP-Seq dataset. b Pie chart of global enrichment profile in ChIP-Seq analysis of WT and mutant endocrine progenitors. Venn diagram depicting c the number of targets bound (P-value < 1e-04 and >4 fold enrichment over input) by WT and mutant HNF1A in endocrine progenitors via ChIP-Seq analysis and, d the overlap of downregulated differentially expressed genes in mutant endocrine progenitors identified by RNA-Seq and ChIP-Seq targets enriched (P-value < 1e-04 and >4 fold enrichment over input) in WT HNF1A but not H126D. e Candidate HNF1A-bound genes that are downregulated in mutant endocrine progenitors. f Heatmap of genes that are both downregulated in RNA-Seq and ChIP-Seq analyses in mutant endocrine progenitors. The colour spectrum indicates relative expression levels within the samples (WT, P1 and P2), where red indicates relatively high expression, blue indicates relatively low expression. g Histogram showing ChIP-Seq enrichment regions. Regions where there is a difference in binding between WT (green) and P2 (HNF1A+/H126D) (red) are highlighted in dotted-line box with the nearest coding gene shown. ChIP-Seq Chromatin immunoprecipitation sequencing. WT wild-type. P1 patient 1, P2 patient 2.
Fig. 5
Fig. 5. HNF1A+/H126D mutation reduces the expression of genes involved in pancreas development, β cell survival and insulin secretion.
a RT-qPCR analysis of TM4SF4, GLIS3, ANKS4B, HNF4A, TSPAN8 and UGT2B4 transcripts in WT (red) and mutant (blue) hPSC-derived endocrine progenitors. n = 3 independent experiments. P-value for TM4SF4 = 0.0238 (P1), 0.0390 (P2); GLIS3 = 0.0239 (P1), 0.0184 (P2); ANKS4B = 0.0081 (P1), 0.0260 (P2); HNF4A = 0.0385 (P1), 0.0449 (P2); TSPAN8 = 0.0112 (P1), 0.0355 (P2); UGT2B4 = 0.0020 (P1), 0.0130 (P2). b RT-qPCR analysis of EndoC-βH1 cells transfected with HNF1A siRNA (si-HNF1A) and non-targeting siRNA as negative control (si-NT). n = 4 independent experiments. P-value for TM4SF4 = 0.0029; GLIS3 = 0.0240; ANKS4B = 0.0017; HNF4A = 0.0172; UGT2B4 = 0.0226. c Western blot analysis for HNF1A protein in AD-293 cells overexpressed with GFP and various HNF1A constructs. n = 3 independent experiments. d RT-qPCR analysis of TM4SF4, GLIS3, ANKS4B, HNF4A, TSPAN8 and UGT2B4 transcripts in AD-293 cells overexpressed with GFP (green) and various WT (red), H126D (blue) and P291fsinsC (purple) HNF1A constructs. n = 3 independent experiments. P-value for TM4SF4 = 0.0076 (WT), 0.0078 (H126D), 0.0077 (P291fsinsC); GLIS3 = 0.0005 (WT), 0.0121 (H126D), 0.0171 (P291fsinsC); ANKS4B = 0.0005 (WT), 0.0004 (H126D); HNF4A: 0.0026 (WT), 0.0078 (H126D), 0.0886 (P291fsinsC); TSPAN8 = 0.0015 (WT), 0.0034 (H126D), 0.0005 (P291fsinsC); UGT2B4 = 0.0035 (WT), 0.0034 (H126D), 0.0035 (P291fsinsC). WT wild-type, P1 patient 1, P2 patient 2. GFP green fluorescent protein. RT-qPCR quantitative reverse transcription polymerase chain reaction. hPSC human pluripotent stem cells. For all statistical analysis: Error bars represent standard error of mean (SEM). Unpaired one-tailed Student’s t-test was performed. Asterisk indicates P-value < 0.05. n.s. non-significant. “See also Fig. S7.” Source data are provided as a Source data file.
Fig. 6
Fig. 6. MODY3-hiPSC-derived mutant β-like cells did not exhibit defects in calcium signaling nor potassium channels.
a Glucose-stimulated insulin secretion of WT (red) and patient-specific (blue) hPSC-derived β-like cells in vitro. n = 3 independent experiments. b Immunohistochemistry stain for INS (red) and nuclear stain using DAPI (blue) in β-like cells after in vivo maturation in mouse kidney capsule for 23 weeks. n = 3 independent experiments. (scale bar: 50 μm). c Glucose-stimulated insulin secretion of WT (red) and patient-specific hPSC-derived β-like (blue) cells after in vivo maturation in mouse kidney capsule for 23 weeks. n = 3 independent experiments; p = 0.0478 (WT). d Insulin secretion of WT β-like cells after stimulation with 2.8 mM glucose (green), 16.7 mM glucose, 10 μM ionomycin, 30 mM KCl or 100 μM glibenclamide. n = 3 independent experiments; p = 0.0017 (ionomycin), 0.0245 (KCl), 0.0672 (glibenclamide). e Ionomycin-stimulated insulin secretion of WT (red) and patient-specific (blue) hPSC-derived β-like cells. n = 3 independent experiments; p = 0.0064 (WT), 0.0038 (P1), 0.0117 (P2). or f KCl-stimulated insulin secretion of WT (red) and patient-specific (blue) hPSC-derived β-like cells. n = 3 independent experiments; p = 0.0158 (WT), 0.0007 (P1), 0.0037 (P2). g Glibenclamide-stimulated insulin secretion of WT (red) and patient-specific (blue) hPSC-derived β-like cells. n = 3 independent experiments; p = 0.0496 (WT), 0.0136 (P1), 0.0203 (P2). All insulin fold changes are normalized to insulin amounts secreted at 2.8 mM glucose (green) under each condition. WT wild-type, P1 patient 1, P2 patient 2. hPSC human pluripotent stem cells. For all statistical analysis: Error bars represent standard error of mean (SEM). Unpaired one-tailed Student’s t-test was performed. Aterisk indicates P-value < 0.05. “See also Fig. S8.” Source data are provided as a Source data file.
Fig. 7
Fig. 7. Decreased GLUT2 expression, glucose uptake and ATP production in MODY3 mutant β-like cells.
a Glucose uptake in WT (red) and patient-specific (blue) hPSC-derived β-like cells. n = 3 independent experiments; p = 0.0182 (P1), 0.0294 (P2). b ATP: ADP ratio in WT (red) and patient-specific (blue) hPSC-derived β-like cells. n = 3 independent experiments; p = 0.0144 (P1), 0.0113 (P2). c RT-qPCR analysis of GLUT1, GLUT2 and GLUT3 transcripts in WT (red) and mutant (blue) hPSC-derived endocrine progenitors. n = 3 independent experiments; P-value for GLUT1 = 0.0125 (P1), 0.0373 (P2); GLUT1 = 0.0068 (P1), 0.0021 (P2). d Immunohistochemistry stain of GLUT2 (red) and DAPI (blue) in WT and mutant differentiated day 20 endocrine progenitors. n = 3 independent experiments. (scale bar:100 μm). e Glucose uptake in WT (red) and patient-specific (blue) hPSC-derived β-like cells in the presence of dimethyl sulfoxide (DMSO) or 60 μM GLUT2 inhibitor, fisetin. Glucose uptake fold changes are normalized to glucose uptake amount in the presence of DMSO in WT. n = 3 independent experiments; p = 0.0362 (WT). WT wild-type, P1 patient 1, P2 patient 2. hPSC human pluripotent stem cells. For all statistical analysis: Error bars represent standard error of mean (SEM). Unpaired one-tailed Student’s t-test was performed. Asterisk indicates P-value < 0.05. n.s. non-significant. “See also Figs. S9 and S10.” Source data are provided as a Source data file.
Fig. 8
Fig. 8. HNF1A H126D mutation reduced the ability of HNF1A to upregulate GLUT2 gene expression.
a RT-qPCR analysis of GLUT2, GLUT1 and GLUT3 transcripts in AD-293 cells overexpressed with GFP (green) and various WT (red), H126D (blue) and P291fsinsC (purple) HNF1A constructs. n = 3 independent experiments; P-value for GLUT2 = 0.0156 (WT), 0.0080 (H126D), 0.0227 (P291fsinsC); GLUT1 = 0.0296 (H126D); GLUT3 = 0.006 (WT), 0.0063 (H126D), 0.0141 (P291fsinsC). b Immunohistochemistry stain for GLUT2 (red) and nuclear stain using DAPI (blue) in AD-293 cells overexpressed with GFP and various HNF1A constructs. n = 3 independent experiments. (scale bar:100 μm). c Immunofluorescence data was quantified by cell counting using ImageJ across three representative images per condition in AD-293 cells overexpressed with GFP (green) and various WT (red), H126D (blue) and P291fsinsC (purple) HNF1A constructs. d Luciferase reporter analysis of GLUT2 promoter activity in AD-293 cells overexpressed with GFP (green) and various WT (red), H126D (blue) and P291fsinsC (purple) HNF1A constructs (n = 3). e RT-qPCR analysis of GLUT2 transcripts in EndoC-βH1 cells transfected with HNF1A siRNA (si-HNF1A) and non-targeting siRNA as negative control (si-NT). n = 6 independent experiments. p = 0.0012. f ChIP-qPCR analysis of HNF1A binding onto GLUT2 promoter in hPSC-derived endocrine progenitors, using HNF1A antibody (red) and negative control IgG (blue). n = 3 independent experiments. One-way ANOVA was performed for group comparison (p = 0.0132, F-critical = 6.3419). Tukey post-hoc test was done for pairwise comparison, *p = 0.0209, **p = 0.0152. g Summary diagram showing the components of stimulus-secretion coupling in human β cell affected by HNF1A H126D mutation. WT wild-type, P1 patient 1, P2 patient 2. GFP green fluorescent protein. ChIP-Seq Chromatin immunoprecipitation sequencing. RT-qPCR quantitative reverse transcription polymerase chain reaction. hPSC human pluripotent stem cells. For all statistical analysis: Error bars represent standard error of mean (SEM). Unpaired one-tailed Student’s t-test was performed for all statistical analysis, otherwise stated. Asterisk indicates P-value < 0.05. n.s. non-significant. “See also Figs. S7 and S11.” Source data are provided as a Source data file.

Similar articles

Cited by

References

    1. Byrne MM, et al. Altered insulin secretory responses to glucose in diabetic and nondiabetic subjects with mutations in the diabetes susceptibility gene MODY3 on chromosome 12. Diabetes. 1996;45:1503–1510. doi: 10.2337/diab.45.11.1503. - DOI - PubMed
    1. Glucksmann MA, et al. Novel mutations and a mutational hotspot in the MODY3 gene. Diabetes. 1997;46:1081–1086. doi: 10.2337/diab.46.6.1081. - DOI - PubMed
    1. Kaisaki PJ, et al. Mutations in the hepatocyte nuclear factor-1alpha gene in MODY and early-onset NIDDM: evidence for a mutational hotspot in exon 4. Diabetes. 1997;46:528–535. doi: 10.2337/diab.46.3.528. - DOI - PubMed
    1. Mendel DB, Crabtree GR. HNF-1, a member of a novel proteins. Biochemistry. 1991;266:677–680. - PubMed
    1. Blumenfeld M, Maury M, Chouard T, Yaniv M, Condamine H. Hepatic nuclear factor 1 (HNF1) shows a wider distribution than products of its known target genes in developing mouse. Development. 1991;113:589–599. doi: 10.1242/dev.113.2.589. - DOI - PubMed

Publication types

MeSH terms

Supplementary concepts