. 2021 May 25;12(1):3088.
doi: 10.1038/s41467-021-23319-1.

Health improvement framework for actionable treatment planning using a surrogate Bayesian model

Affiliations

Health improvement framework for actionable treatment planning using a surrogate Bayesian model

Kazuki Nakamura et al. Nat Commun. .

Abstract

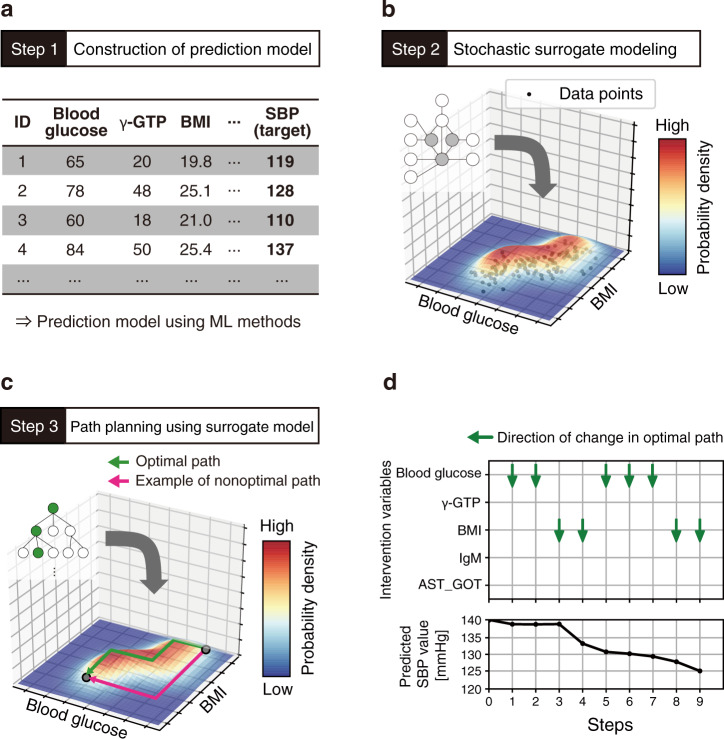
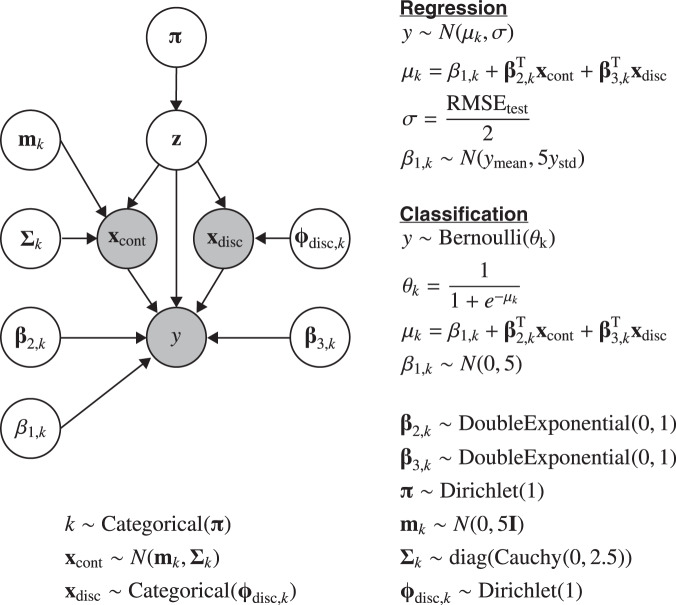
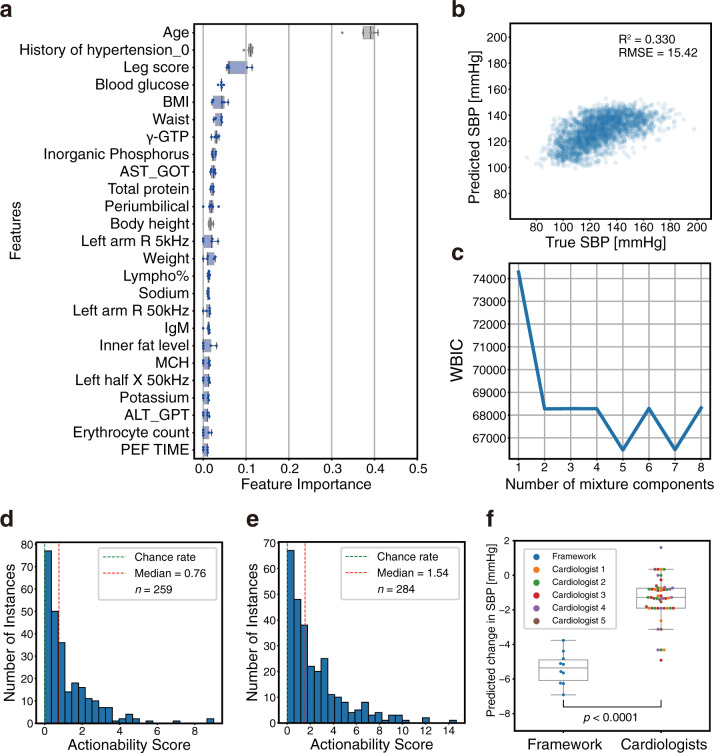
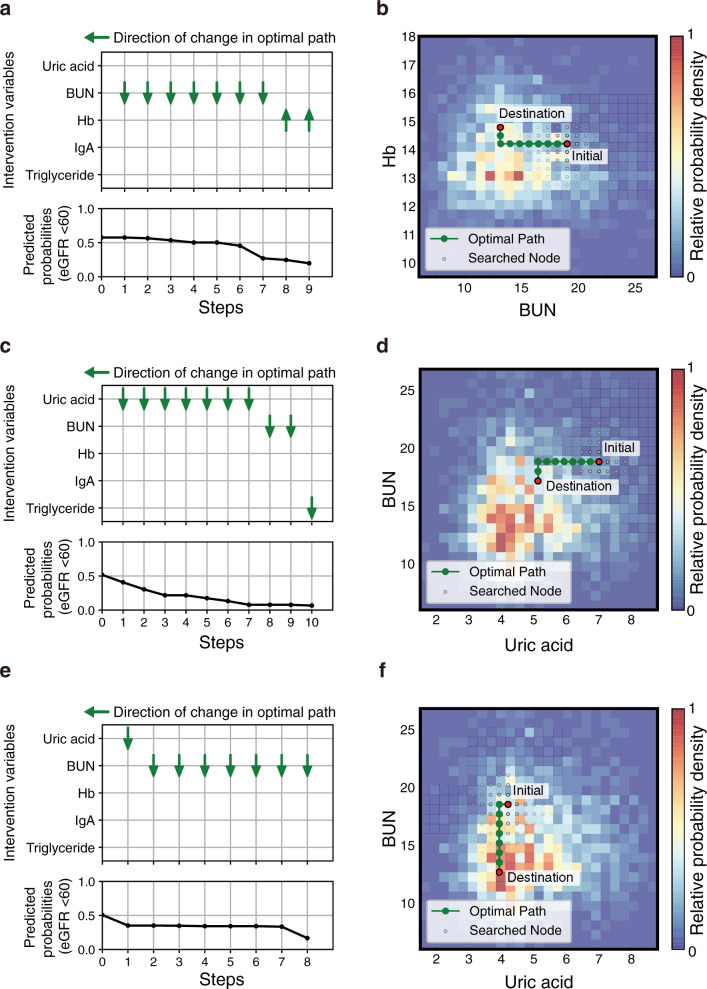
Clinical decision-making regarding treatments based on personal characteristics leads to effective health improvements. Machine learning (ML) has been the primary concern of diagnosis support according to comprehensive patient information. A prominent issue is the development of objective treatment processes in clinical situations. This study proposes a framework to plan treatment processes in a data-driven manner. A key point of the framework is the evaluation of the actionability for personal health improvements by using a surrogate Bayesian model in addition to a high-performance nonlinear ML model. We first evaluate the framework from the viewpoint of its methodology using a synthetic dataset. Subsequently, the framework is applied to an actual health checkup dataset comprising data from 3132 participants, to lower systolic blood pressure and risk of chronic kidney disease at the individual level. We confirm that the computed treatment processes are actionable and consistent with clinical knowledge for improving these values. We also show that the improvement processes presented by the framework can be clinically informative. These results demonstrate that our framework can contribute toward decision-making in the medical field, providing clinicians with deeper insights.


Conflict of interest statement

Kazuki Nakamura is an employee of Kyowa Hakko Bio Co., Ltd. All other authors declare no competing interests.

Figures

Fig. 1
Fig. 1. Schematic representation of the framework for planning actionable paths for treatment using hierarchical Bayesian modeling.
The framework consists of three steps. A schematic is given as an example in which a path is planned to improve the systolic blood pressure (SBP) owing to changes in blood data and body composition data. a Construction of a prediction model from the dataset. A variable SBP is set as the response variable in this case. b Construction of a stochastic surrogate model based on the original dataset and the predicted values of the prediction model. This figure shows a schematic representation of a two-variable space regarding blood glucose and body mass index (BMI). The heatmap and vertical axis represent the existence probability of data in the variable space, which is expressed by the stochastic surrogate model. c, d Actionable path planning is applied to improve the response variable. The path is represented as a set of multistep transitions on explanatory variables. In our framework, the optimal path (green line in (c)) is planned on the grid graph with high probabilities in the variable space based on the stochastic surrogate model. Conversely, the nonoptimal path (red line in (c)) could pass through nodes with low probability. γ-GTP gamma glutamyl transferase, IgM immunoglobulin M, AST_GOT aspartate transaminase.
Fig. 2
Fig. 2. Graphical model representation of stochastic surrogate model.
Nodes in the graphical model are represented as follows: xcont, continuous explanatory variables; xdisc, discrete explanatory variables; y, response variable predicted by the ML model; z, the parameter of the mixture components; and all the others, prior distributions. The formulation for y differs between regression and classification tasks. k represents each mixture component, and Σk is a diagonal matrix with elements according to the Cauchy distribution. The symbol RMSEtest in the equation represents a root-mean-squared error of the regression model, and ymean and ystd represent the mean and standard deviation values of the predicted response variable, respectively.
Fig. 3
Fig. 3
The intervention variable space was regarded as a grid graph, and the grid points (nodes) were connected to plan a path. The nodal probability was calculated using the surrogate model. The actionability was defined as the product of nodal probabilities on a specified path. The most actionable (optimal) path for each node was calculated, and the output path was the optimal path to the node with the most improved predictive value within the search iteration count, L. Pseudocode of path search algorithm.
Fig. 4
Fig. 4. Examples of actionable paths planned on synthetic dataset.
The optimal paths for improving the response variable predicted by the ML model are represented for randomly selected two examples: instance A (ac) and instance B (df). a, d The orders of changes in the explanatory variables in the optimal path and the accompanying changes in the predicted values. In the transition steps, the upward or downward arrow represents a unit increase or decrease in the explanatory variable, respectively. b, e Two-dimensional (2D) plots of the path. The 2D plots are shown regarding the selected two variables: X1 and X2 (b), and X2 and X3 (e). In the heatmaps, the probability density of the actual data, normalized by the panel with the maximum number of data, is expressed. c, f Three-dimensional (3D) plots of the path.
Fig. 5
Fig. 5. Application of proposed framework on systolic blood pressure (SBP) regression task using the Iwaki health promotion project (IHPP) dataset.
a Feature importance: these 25 features were selected by recursive feature elimination (RFE) to predict the SBP. RFE was performed with fivefold cross-validation, and the feature importance when 25 variables remained is shown for each fold (n = 5). The plot color represents the following: gray: variables which cannot be intervened, and blue: intervenable variables. Details of features are described in Supplementary Data 1. b Plot for prediction vs. true response variable. c Widely applicable Bayesian information criterion (WBIC) values of stochastic surrogate models with 1–8 mixture components. d, e Histogram of actionability scores with intervention variables based on data-driven selection (d) or hypothesis-driven selection (e) at different instances. An actionability score of zero indicates that the actionability of the optimal path is equivalent to that of the baseline path. f Comparison of predicted SBP reduction between framework-proposed paths and cardiologist-selected paths. Health improvement paths constructed based on hypothesis-driven intervention variables using our framework were compared with the cardiologist-selected paths among framework-proposed paths and random paths. Each cardiologist evaluated the same randomly selected instances (n = 10). Statistical significance was calculated using the Welch’s t-test (two-sided). In box-plot, center line represents median; box limits, upper and lower quartiles; whiskers, 1.5× interquartile range.
Fig. 6
Fig. 6. Examples of personal actionable paths for treatment with intervention variables based on data-driven selection in systolic blood pressure (SBP) regression task.
The optimal paths for improving the response variable predicted by the ML model are represented for randomly selected three examples: instance 1 (a) and (b), instance 2 (c) and (d), and instance 3 (e) and (f). a, c, e The orders of changes in the explanatory variables in the optimal path and the accompanying changes in the predicted values. In the transition steps, the upward or downward arrow represents a unit increase or decrease in the explanatory variable, respectively. b, d, f 2D plots of the path. The 2D plots are shown regarding the two influential variables in the optimal path: blood glucose and leg score (b), leg score and gamma glutamyl transferase (γ-GTP) (d), and blood glucose and leg score (f). In the heatmaps, the probability density of the actual data, normalized by the panel with the maximum number of data, is expressed. 3D plots of the path are shown in Supplementary Fig. 5. BMI body mass index.
Fig. 7
Fig. 7. Application of proposed framework on chronic kidney disease (CKD) risk classification task using the Iwaki health promotion project (IHPP) dataset.
a Feature importance: these 25 features were selected by recursive feature elimination (RFE) to predict the estimated glomerular filtration rate (eGFR) category. RFE was performed with five-fold cross-validation, and the feature importance when 25 variables remained is shown for each fold (n = 5). The plot color represents the following: gray: variables which cannot be intervened, and blue: intervenable variables. Details of features are described in Supplementary Data 1. b Classification model score. AUC area under the curve. c Widely applicable Bayesian information criterion (WBIC) values of stochastic surrogate models with 1–8 mixture components. d, e Histogram of actionability scores with intervention variables based on data-driven selection (d) or hypothesis-driven selection (e) at different instances. An actionability score of zero indicates that the actionability of the optimal path is equivalent to that of the baseline path. f Comparison of predicted CKD risk reduction between framework-proposed paths and nephrologist-selected paths. Health improvement paths constructed based on hypothesis-driven intervention variables using our framework were compared with the nephrologist-selected paths among framework-proposed paths and random paths. Each nephrologist evaluated the same randomly selected instances (n = 10). Statistical significance was calculated using the Welch’s t-test (two-sided). In box-plot, center line represents median; box limits, upper and lower quartiles; whiskers, 1.5× interquartile range.
Fig. 8
Fig. 8. Examples of personal actionable paths for treatment with intervention variables based on data-driven selection in chronic kidney disease (CKD) risk classification task.
The optimal paths for improving the response variable predicted by the ML model are represented for randomly selected three examples: instance 4 (a) and (b), instance 5 (c) and (d), and instance 6 (e) and (f). a, c, e The orders of changes in the explanatory variables in the optimal path and the accompanying changes in the predicted values. In the transition steps, the upward or downward arrow represents a unit increase or decrease in the explanatory variable, respectively. b, d, f 2D plots of the path. The 2D plots are shown regarding the two influential variables in the optimal path: hemoglobin (Hb) and blood urea nitrogen (BUN) (b), and BUN and uric acid (d) and (f). In the heatmaps, the probability density of the actual data, normalized by the panel with the maximum number of data, is expressed. 3D plots of the path are shown in Supplementary Fig. 8. eGFR estimated glomerular filtration rate, IgA immunoglobulin A.

References

    1. Boult C, et al. Early effects of “guided care” on the quality of health care for multimorbid older persons: a cluster-randomized controlled trial. J. Gerontol. 2008;63:321–327. doi: 10.1093/gerona/63.3.321. - DOI - PubMed
    1. Wolff JL, et al. Effects of guided care on family caregivers. Gerontologist. 2010;50:459–470. doi: 10.1093/geront/gnp124. - DOI - PMC - PubMed
    1. Boyd CM, et al. The effects of guided care on the perceived quality of health care for multi-morbid older persons: 18-month outcomes from a cluster-randomized controlled trial. J. Gen. Intern. Med. 2010;25:235–242. doi: 10.1007/s11606-009-1192-5. - DOI - PMC - PubMed
    1. Djulbegovic B, Guyatt GH. Evidence-based practice is not synonymous with delivery of uniform health care. JAMA. 2014;312:1293. doi: 10.1001/jama.2014.10713. - DOI - PubMed
    1. Goetz LH, Schork NJ. Personalized medicine: motivation, challenges, and progress. Fertil. Steril. 2018;109:952–963. doi: 10.1016/j.fertnstert.2018.05.006. - DOI - PMC - PubMed

Publication types