. 2021 May 25;12(1):2721.
doi: 10.1038/s41467-021-22799-5.

Disproportionate exposure to urban heat island intensity across major US cities

Affiliations

Disproportionate exposure to urban heat island intensity across major US cities

Angel Hsu et al. Nat Commun. .

Erratum in

Abstract

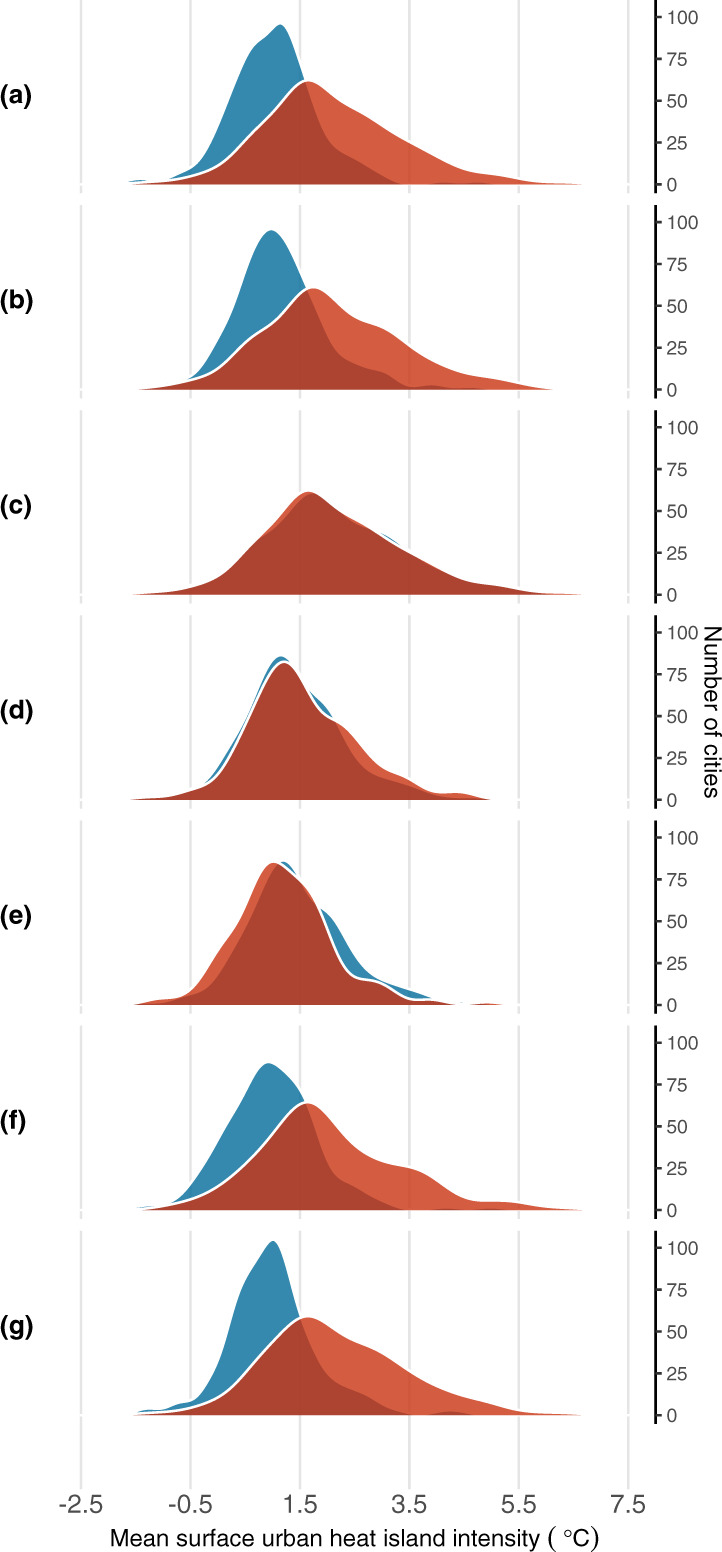
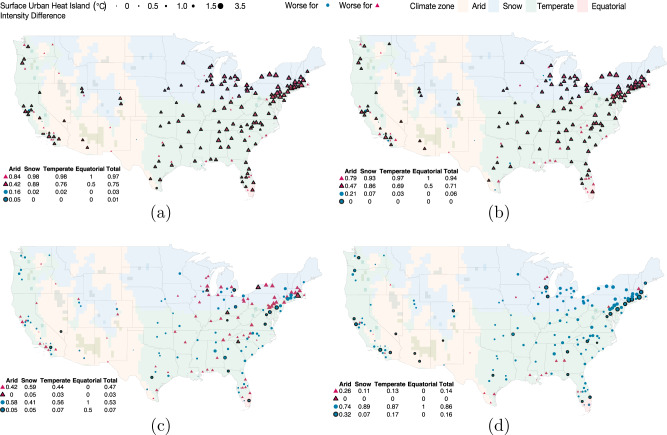
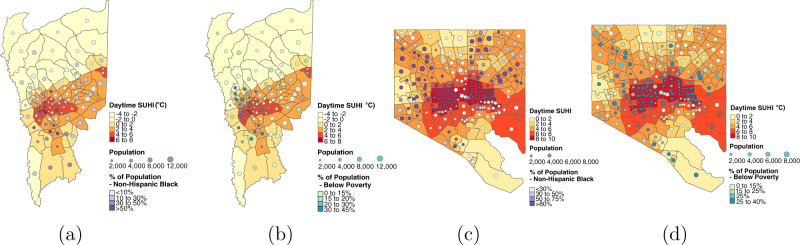
Urban heat stress poses a major risk to public health. Case studies of individual cities suggest that heat exposure, like other environmental stressors, may be unequally distributed across income groups. There is little evidence, however, as to whether such disparities are pervasive. We combine surface urban heat island (SUHI) data, a proxy for isolating the urban contribution to additional heat exposure in built environments, with census tract-level demographic data to answer these questions for summer days, when heat exposure is likely to be at a maximum. We find that the average person of color lives in a census tract with higher SUHI intensity than non-Hispanic whites in all but 6 of the 175 largest urbanized areas in the continental United States. A similar pattern emerges for people living in households below the poverty line relative to those at more than two times the poverty line.


Conflict of interest statement

The authors declare no competing interests.

Figures

Fig. 1
Fig. 1. Distribution across cities of mean summer daytime surface urban heat island (SUHI) intensity by sociodemographic group.
Each panel compares kernel density estimates for two sociodemographic groups. Diagrams are normalized so that the area under each curve equals 175 cities. Hispanic is defined as all who report “Hispanic, Latino, or Spanish origin” as their ethnicity, regardless of race. People of color includes all Hispanic and all who do not identify as white alone. a Non-Hispanic white vs. all people of color. b 2× above poverty vs. below poverty. c Below poverty vs. all people of color. d Over 5 vs. under 5. e Under 65 vs. over 65. f Over 65: non-Hispanic white vs. all people of color. g Under 5: non-Hispanic white vs. all people of color. a illustrates that people of color have an average SUHI exposure greater than 2 °C in more cities than non-Hispanic whites.
Fig. 2
Fig. 2. Sociodemographic differences in mean summer daytime surface urban heat island intensity by major urban area.
Symbols outlined in black depict statistically significant differences in mean exposures (p < 0.05). Tables embedded in the lower left-hand corners indicate proportion of cities in each category (e.g., worse for ▵ or worse for ◦) by climate zone. Supplementary Table 1 provides detailed results for each city. Hispanic is defined as all who report “Hispanic, Latino, or Spanish origin” as their ethnicity, regardless of race. People of color includes all Hispanic and all who do not identify as white alone. a Non-Hispanic white (◦) and people of color (▵). b Above 2 × poverty (◦) and below poverty (▵). c Below poverty (◦) and people of color (▵). d Below 65 (◦) and above 65 (▵).
Fig. 3
Fig. 3. Distribution of surface urban heat island intensity (SUHI) by race and income in Greenville, SC, and Baltimore, MD.
The correlation between SUHI intensity (dark orange and red) and census tracts that are predominantly non-Hispanic Black (in dark purple) and low-income areas (in dark teal) differs across cities. Hispanic is defined as all who report “Hispanic, Latino, or Spanish origin” as their ethnicity, regardless of race. a Greenville, SC: SUHI and race. b Greenville, SC: SUHI and income. c Baltimore, MD: SUHI and race. d Baltimore, MD: SUHI and income.

Similar articles

Cited by

References

    1. Oke TR. The energetic basis of the urban heat island. Q. J. R. Meteorolog. Soc. 1982;108:1–24.
    1. Borden, K. A. & Cutter, S. L. Spatial patterns of natural hazards mortality in the United States. Int. J. Health Geogr.7(1), 64 (2008). - PMC - PubMed
    1. Eunice Lo, Y. T. et al. Increasing mitigation ambition to meet the Paris Agreement’s temperature goal avoids substantial heat-related mortality in U.S. Cities. Sci. Adv. 10.1126/sciadv.aau4373 (2019). - PMC - PubMed
    1. NOAA. Weather Related Fatality and Injury Statistics. https://www.weather.gov/hazstat/ (2018).
    1. Anderson GB, Bell ML. Heat waves in the United States: mortality risk during heat waves and effect modification by heat wave characteristics in 43 U.S. communities. Environ. Health Perspect. 2011;119:210–218. - PMC - PubMed

Publication types

MeSH terms