. 2021 May 25;12(1):3130.
doi: 10.1038/s41467-021-23346-y.

Ectopic targeting of CG DNA methylation in Arabidopsis with the bacterial SssI methyltransferase

Affiliations

Ectopic targeting of CG DNA methylation in Arabidopsis with the bacterial SssI methyltransferase

Wanlu Liu et al. Nat Commun. .

Abstract

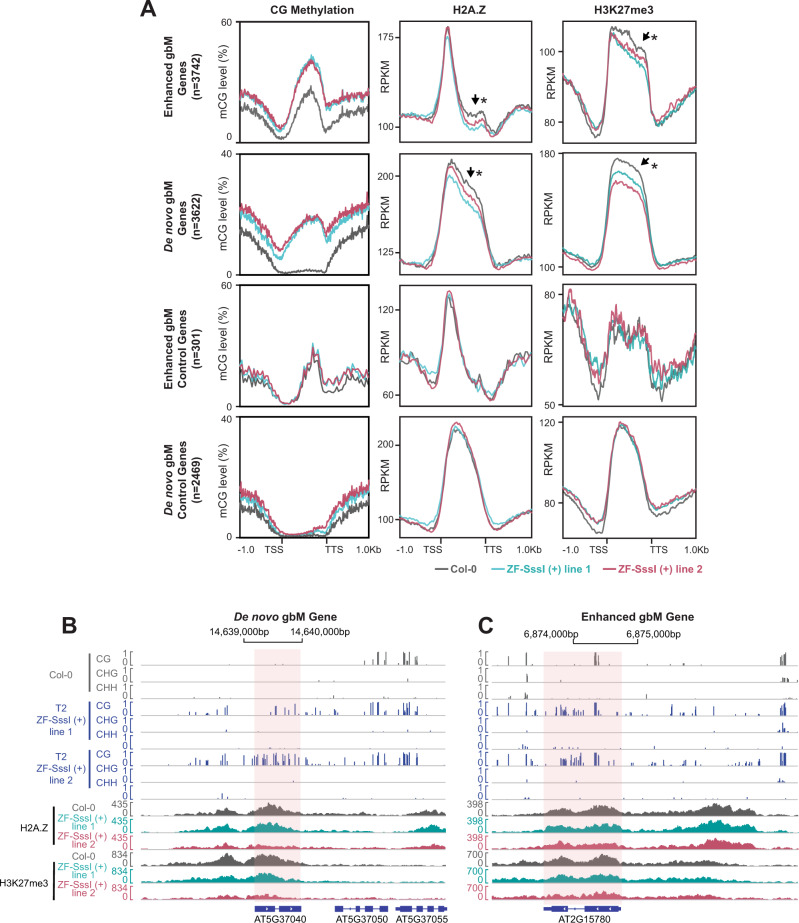
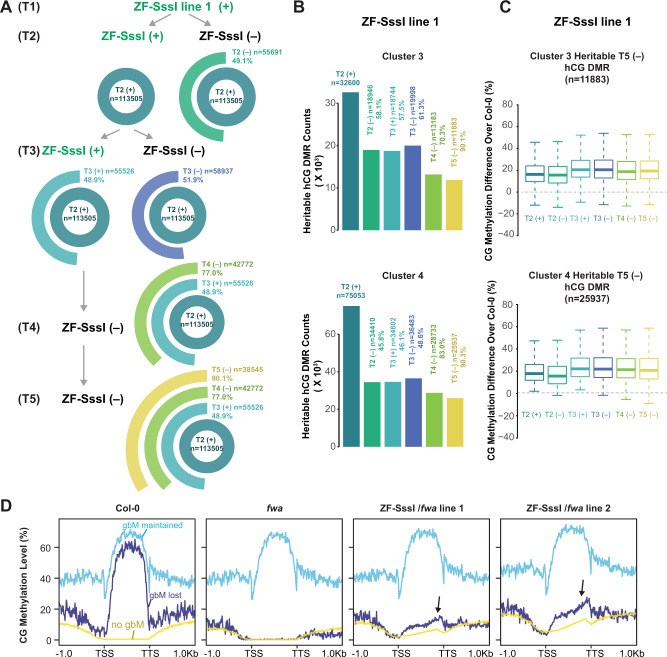
The ability to target epigenetic marks like DNA methylation to specific loci is important in both basic research and in crop plant engineering. However, heritability of targeted DNA methylation, how it impacts gene expression, and which epigenetic features are required for proper establishment are mostly unknown. Here, we show that targeting the CG-specific methyltransferase M.SssI with an artificial zinc finger protein can establish heritable CG methylation and silencing of a targeted locus in Arabidopsis. In addition, we observe highly heritable widespread ectopic CG methylation mainly over euchromatic regions. This hypermethylation shows little effect on transcription while it triggers a mild but significant reduction in the accumulation of H2A.Z and H3K27me3. Moreover, ectopic methylation occurs preferentially at less open chromatin that lacks positive histone marks. These results outline general principles of the heritability and interaction of CG methylation with other epigenomic features that should help guide future efforts to engineer epigenomes.


Conflict of interest statement

The authors declare no competing interests.

Figures

Fig. 1
Fig. 1. SssI-targeted methylation at the FWA promoter cause silencing.
A Cartoon depicting the RNA-directed DNA methylation pathway. B Flowering time of untransformed controls, and T1 ZF-SssI lines in the fwa background or mutants that have been introgressed into the fwa background. The X-axis represents the number of leaves. Each dot represents one individual plant. Dashed lines indicate the cutoff we chose to define ‘early flowering’ versus ‘late flowering’ (*p-value < 0.01 compared to fwa, Welch two-sample t-test). C Flowering time of untransformed control lines and four representative ZF-SssI T2 lines in the fwa background or mutants that have been introgressed into the fwa background (*p-value < 0.01 compared to relative controls, Welch two-sample t-test). D CG, CHG, and CHH methylation levels over the FWA promoter measured by bisulfite (BS)-PCR-seq in untransformed controls and ZF-SssI in the fwa background or mutants that have been introgressed into the fwa background. The barplot represents data from one representative T2 plant for each genotype tested. Every single bar represents one cytosine. Black triangles and orange shaded rectangle regions indicate the designed ZF binding sites. The relative position of the three regions analyzed in the FWA gene are indicated as blue squares. E Flowering time of untransformed Col-0, fwa, and two representative T3 ZF-SssI lines with (+) or without (‒) the transgene. (* p-value < 0.01 compared to fwa, Welch two-sample t-test). Source data underlying Figs. 1B, 1C, and 1E are provided as a Source Data file.
Fig. 2
Fig. 2. SssI-targeted genome-wide heritable CG methylation.
A Screenshot for CG, CHG, and CHH methylation of representative ZF-SssI lines during T2 and T3 with (+) or without (‒) the transgene in Col-0 background over the FWA locus. Each bar represents a single base-pair. Black triangles indicate the designed ZF binding sites. B Screenshot for CG, CHG, and CHH methylation of representative ZF-SssI lines during T2 and T3 with (+) or without (‒) the transgene in the Col-0 background over a selected genomic region. C Barplot of genome-wide CG, CHG, and CHH methylation difference for ZF-SssI lines during T2 and T3 with (+) or without (‒) the transgene over Col-0. Error bars represent standard errors, center of error bars represent mean. D Genome-wide metaplot of CG methylation for ZF-SssI lines during T2 and T3 with (+) or without (‒) the transgene. The curve represents the mean, shaded area around the curve represents standard errors (n = 4). E CG methylation metaplot for Col-0 and ZF-SssI lines during T2 and T3 with (+) or without (‒) the transgene over protein-coding genes (left two panels) or transposable elements (TEs) (right two panels). The curve represents the mean, shaded area around the curve represents standard errors (n = 4).
Fig. 3
Fig. 3. Characteristics of hyper CG-methylated sites in ZF-SssI.
A CG cytosine counts grouped by CG methylation level in Col-0 and ZF-SssI lines during T2 and T3 with (+) or without (‒) the transgene. B CG methylation level of 200 bp bins in Col-0 (upper panel) and CG methylation difference in ZF-SssI lines during T2 and T3 with (+) or without (‒) the transgene (lower panel) ranked by the CG methylation level in Col-0. Methylation difference is the absolute difference in CG methylation levels between ZF-SssI lines and Col-0. Four clusters are defined by the methylation level of 200 bp bins in Col-0. N represents the number of ranked percentiles within the cluster. C Count of hyper and hypo differentially methylated regions (DMRs) in ZF-SssI lines during T2 and T3 with (+) or without (‒) the transgene in the four clusters. D Genomic distribution (Observed versus Expected) of the hyper CG DMRs in ZF-SssI lines during T2 and T3 with (+) or without (‒) the transgene in Clusters 2, 3, and 4.
Fig. 4
Fig. 4. The epigenetic landscape for hyper CG DMRs of Clusters 3 and 4 in Col-0.
Metaplot of the CG methylation difference of ZF-SssI over Col-0 (ZF-SssI (+) lines during T2 and T3 merged) (A), ATAC-seq signals (B), H2A (C) and H3 (D) occupancy, H2A.Z (E), H3K4me1 (F), H3K4me3 (G), H3K27me3 (H), H3K36me3 (I), and PanH3Ac enrichment (J) over hyper CG DMRs and CG-methylation-equivalent control regions in Clusters 3 and 4.
Fig. 5
Fig. 5. H2A.Z and H3K27me3 reduction over hypermethylated genes.
A Metaplots of CG methylation (T2 and T3 merged), H2A.Z, and H3K27me3 levels in Col-0 and two representative ZF-SssI (+) lines over genes with ‘Enhanced gbM’ or ‘De novo gbM’ as well as a set of control genes with similar gene body CG methylation but no hypermethylation. *p-value < 0.05, Welch Two-Sample t-test (‘De novo gbM’ group, hypothesis testing performed on full-length genic regions; ‘Enhanced gbM’ group, hypothesis testing performed on last 50% of genic regions). The black arrow indicates the regions with reduced H2A.Z and H3K27me3. B, C Screenshot of WGBS tracks in Col-0 and two representative T2 ZF-SssI (+) lines, as well as H2A.Z and H3K27me3 ChIP-seq tracks in Col-0 and two representative T2 ZF-SssI (+) lines over selected ‘De novo gbM’ (B) and ‘Enhanced gbM’ (C) genes. Source data underlying Figure 5A are provided as a Source Data file.
Fig. 6
Fig. 6. Targeted CG methylation is heritable.
A Multilevel pie chart of the number of heritable hyper CG DMRs in ZF-SssI line 1 during T2, T3, T4, and T5 ((+) indicates ZF-SssI lines containing the transgene, which could be homozygous or heterozygous in the indicated generation; (‒) indicates plants without the transgene in the indicated generation). B Barplot for the number of heritable hyper CG DMRs over Clusters 3 and 4 in ZF-SssI line 1 during T2, T3, T4, and T5. For the percentage of heritable hyper CG DMRs T2 (‒), T3 (+), and T3 (‒) are compared with T2 (+); T4 (‒) is compared with T3 (+); T5 (‒) is compared with T4 (‒). C Boxplot of CG methylation difference level of ZF-SssI during T2 to T5 over Col-0 in Clusters 3, and 4 heritable hyper CG DMRs in ZF-SssI line 1 (‒) during T5. The middle line shows the median; boxes represent the 25th (bottom) and 75th (top) percentiles; and bars represent the minimum and maximum points within the 1.5× interquartile range. D Metaplot of CG methylation in Col-0, fwa, and two ZF-SssI lines in the fwa background over ‘no gbM’, ‘gbM lost’, and ‘gbM maintained’ protein-coding genes. ‘no gbM’ represents genes with no gbM in fwa and Col-0; ‘gbM lost’ represents genes that lost gbM in fwa compared with Col-0; ‘gbM maintained’ represents genes that maintained gbM in fwa compared to Col-0. The black arrow indicates the hCG in ZF-SssI/fwa lines over genes that had lost gbM in fwa.

Similar articles

Cited by

References

    1. Du J, Johnson LM, Jacobsen SE, Patel DJ. DNA methylation pathways and their crosstalk with histone methylation. Nat. Rev. Mol. Cell Biol. 2015;16:519–532. doi: 10.1038/nrm4043. - DOI - PMC - PubMed
    1. Feng S, et al. Conservation and divergence of methylation patterning in plants and animals. Proc. Natl Acad. Sci. USA. 2010;107:8689–8694. doi: 10.1073/pnas.1002720107. - DOI - PMC - PubMed
    1. Zilberman D, Gehring M, Tran RK, Ballinger T, Henikoff S. Genome-wide analysis of Arabidopsis thaliana DNA methylation uncovers an interdependence between methylation and transcription. Nat. Genet. 2007;39:61–69. doi: 10.1038/ng1929. - DOI - PubMed
    1. Law JA, Jacobsen SE. Establishing, maintaining and modifying DNA methylation patterns in plants and animals. Nat. Rev. Genet. 2010;11:204–220. doi: 10.1038/nrg2719. - DOI - PMC - PubMed
    1. Blevins T, et al. Identification of Pol IV and RDR2-dependent precursors of 24 nt siRNAs guiding de novo DNA methylation in Arabidopsis. elife. 2015;4:e09591. doi: 10.7554/eLife.09591. - DOI - PMC - PubMed

Publication types

MeSH terms