. 2021 May 25;12(1):3137.
doi: 10.1038/s41467-021-23236-3.

Arbuscular mycorrhizal trees influence the latitudinal beta-diversity gradient of tree communities in forests worldwide

Yonglin Zhong  1 Chengjin Chu  2 Jonathan A Myers  3 Gregory S Gilbert  4 James A Lutz  5 Jonas Stillhard  6 Kai Zhu  4 Jill Thompson  7 Jennifer L Baltzer  8 Fangliang He  9   10   11 Joseph A LaManna  12 Stuart J Davies  13 Kristina J Aderson-Teixeira  13   14 David F R P Burslem  15 Alfonso Alonso  16 Kuo-Jung Chao  17 Xugao Wang  18 Lianming Gao  19 David A Orwig  20 Xue Yin  1 Xinghua Sui  1 Zhiyao Su  21 Iveren Abiem  22   23   24 Pulchérie Bissiengou  25 Norm Bourg  14 Nathalie Butt  26   27 Min Cao  28 Chia-Hao Chang-Yang  29 Wei-Chun Chao  30 Hazel Chapman  24 Yu-Yun Chen  31 David A Coomes  32 Susan Cordell  33 Alexandre A de Oliveira  34 Hu Du  35 Suqin Fang  1 Christian P Giardina  33 Zhanqing Hao  36 Andrew Hector  37 Stephen P Hubbell  38 David Janík  39 Patrick A Jansen  13   40 Mingxi Jiang  41 Guangze Jin  42 David Kenfack  13   43 Kamil Král  39 Andrew J Larson  44 Buhang Li  1 Xiankun Li  45 Yide Li  46 Juyu Lian  47 Luxiang Lin  28 Feng Liu  48 Yankun Liu  49 Yu Liu  10   11 Fuchen Luan  50 Yahuang Luo  19 Keping Ma  51 Yadvinder Malhi  52 Sean M McMahon  13   53 William McShea  14 Hervé Memiaghe  25 Xiangcheng Mi  51 Mike Morecroft  54 Vojtech Novotny  55 Michael J O'Brien  56 Jan den Ouden  57 Geoffrey G Parker  58 Xiujuan Qiao  41 Haibao Ren  51 Glen Reynolds  59 Pavel Samonil  39 Weiguo Sang  60 Guochun Shen  11 Zhiqiang Shen  1 Guo-Zhang Michael Song  61 I-Fang Sun  31 Hui Tang  1 Songyan Tian  49 Amanda L Uowolo  33 María Uriarte  62 Bin Wang  45 Xihua Wang  11 Youshi Wang  1 George D Weiblen  63 Zhihong Wu  50 Nianxun Xi  1 Wusheng Xiang  45 Han Xu  46 Kun Xu  64 Wanhui Ye  47 Mingjian Yu  65 Fuping Zeng  35 Minhua Zhang  10   11 Yingming Zhang  50 Li Zhu  51 Jess K Zimmerman  66
Affiliations

Arbuscular mycorrhizal trees influence the latitudinal beta-diversity gradient of tree communities in forests worldwide

Yonglin Zhong et al. Nat Commun. .

Abstract

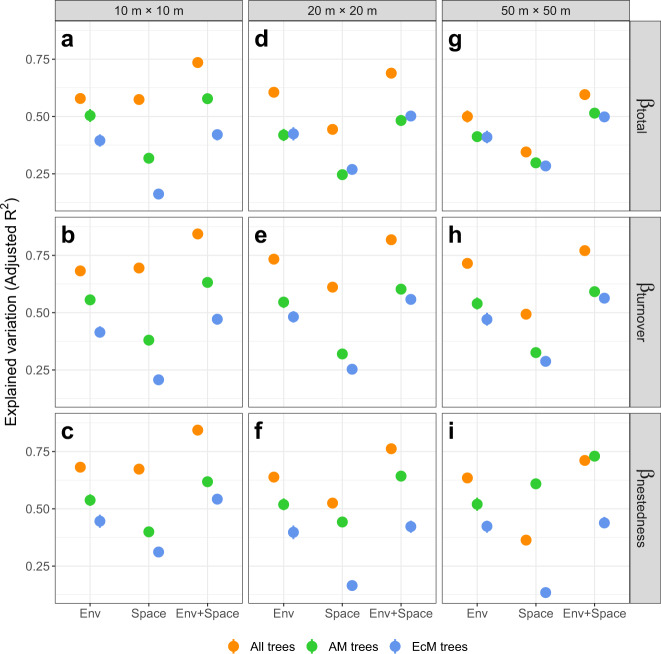
Arbuscular mycorrhizal (AM) and ectomycorrhizal (EcM) associations are critical for host-tree performance. However, how mycorrhizal associations correlate with the latitudinal tree beta-diversity remains untested. Using a global dataset of 45 forest plots representing 2,804,270 trees across 3840 species, we test how AM and EcM trees contribute to total beta-diversity and its components (turnover and nestedness) of all trees. We find AM rather than EcM trees predominantly contribute to decreasing total beta-diversity and turnover and increasing nestedness with increasing latitude, probably because wide distributions of EcM trees do not generate strong compositional differences among localities. Environmental variables, especially temperature and precipitation, are strongly correlated with beta-diversity patterns for both AM trees and all trees rather than EcM trees. Results support our hypotheses that latitudinal beta-diversity patterns and environmental effects on these patterns are highly dependent on mycorrhizal types. Our findings highlight the importance of AM-dominated forests for conserving global forest biodiversity.


Conflict of interest statement

The authors declare no competing interests.

Figures

Fig. 1
Fig. 1. Global distribution of 45 forest plots.
Plots range in size from 2.1 ha (Nanjenshan) to 60 ha (Jianfengling) and in latitude from 21.5 °S (Ilha do Cardoso, Brasil) to 61.3 °N (Scotty Creek, Canada), covering all continents with forests (i.e., Asia, Africa, Europe, South America, North America, and Oceania).
Fig. 2
Fig. 2. Latitudinal gradients in tree beta-diversity.
Total beta-diversity, species turnover, and species nestedness of all trees, AM trees, and EcM trees across latitudes at quadrat scales of 10 m × 10 m (ac), 20 m × 20 m (df), and 50 m × 50 m (gi). Orange points represent total beta-diversity and its two components (species turnover & nestedness) of all trees and orange lines represent their latitudinal patterns. Green points represent total beta-diversity and its components of AM trees and green lines represent their latitudinal patterns. Blue points represent total beta-diversity and its components of EcM trees and blue lines represent their latitudinal patterns. Points are the mean values and the error bars are the 95% confidence intervals, estimated using the non-parametric bootstrapping method (n = 200). In total, 200 replicates of average pairwise beta-diversity and its components were calculated based on 30, 15, and 15 randomly sampled quadrats of 10 m × 10 m, 20 m × 20 m, and 50 m × 50 m from each forest plot, respectively. Solid lines indicate significant relationships with latitude whereas dashed lines indicate non-significant relationships fitted using the beta regression. The error bands (shaded areas) are the 95% confidence intervals of the fitted relationships, with sample size n = 45 for all trees, n = 44 for AM trees, and n = 43 for EcM trees at the 10 m × 10 m scale; with n = 45 for all trees, n = 44 for AM trees, and n = 44 for EcM trees at the 20 m × 20 m scale; and with n = 41 for all trees, n = 40 for AM trees, and n = 41 for EcM trees at the 50 m × 50 m scale.
Fig. 3
Fig. 3. Variation partitioning of tree beta-diversity.
Variation of total beta-diversity, species turnover, and species nestedness of all trees, AM trees, and EcM trees at quadrats scales of 10 m × 10 m (ac), 20 m × 20 m (df), and 50 m × 50 m (gi) explained by spatial and environmental variables. Orange, green, and blue points represent total beta-diversity and its two components (species turnover & nestedness) of all trees, AM trees, and EcM trees. “Env”, “Space”, and “Env + Space” represent the effects of environmental variables, spatial variables, and both, respectively. Average total beta-diversity and its two components were calculated based on 30, 15, and 15 randomly sampled quadrats of 10 m × 10 m, 20 m × 20 m, and 50 m × 50 m from each forest plot, respectively. The calculation and variation partitioning of total beta-diversity and its components were repeated 200 times. Means and 95% confidence intervals (95% CIs) of explained variation of total beta-diversity and its components were estimated using the non-parametric bootstrapping (n = 200 replicates). The means were showed as points and 95% CIs were showed as error bars. Differences between the variation explained by spatial and environmental variables were tested for significance using two-sided Mann–Whitney U tests: n.s. P ≥ 0.05, * P < 0.05, ** P < 0.01, *** P < 0.001. W = 19225 and P = 0.5029 for species turnover, W = 21765 and P = 0.127 for species nestedness, and W = 20557 and P = 0.6303 for total beta-diversity at the scale of 10 m × 10 m, and P < 0.0001 for others.
Fig. 4
Fig. 4. Specific effects of environmental variables on latitudinal gradients in tree beta-diversity.
Relative importance of five most important environmental factors for total beta-diversity, species turnover, and species nestedness of all trees (ac), AM trees (df), and EcM trees (gi) at the scale of 20 m × 20 m. Total beta-diversity and its components are the mean values of 200 replicates of average pairwise beta-diversity and its component metrics calculated based on 15 randomly sampled quadrats of 20 m × 20 m from each forest plot. The relative importance of variables was ranked by the increase in node purity (horizontal axis). The proportion of variance displayed was explained by all of 34 environmental variables. Circle points indicate significant importance of predictors whereas triangles indicate non-significant importance of predictors. The meanings of environmental variables are as follows: bio_01 = Annual Mean Temperature, bio_02 = Mean Diurnal Range (Mean of monthly (max temp - min temp)), bio_05 = Max Temperature of Warmest Month, bio_06 = Min Temperature of Coldest Month, bio_07 = Temperature Annual Range (BIO5-BIO6), bio_08 = Mean Temperature of Wettest Quarter, bio_10 = Mean Temperature of Warmest Quarter, bio_12 = Annual Precipitation, bio_13 = Precipitation of Wettest Month, bio_16 = Precipitation of Wettest Quarter, bio_18 = Precipitation of Warmest Quarter, srad = Solar Radiation, pet = Potential Evapotranspiration, elev = Elevation, aspect = Slope Aspect, aspect.r = Range of Aspect, convex.r = Range of Curvature, slope.cv = Coefficient of Variation of Slope, convex.cv = Coefficient of Variation of Curvature.

References

    1. Myers JA, LaManna JA. The promise and pitfalls of beta-diversity in ecology and conservation. J. Veg. Sci. 2016;27:1081–1083. doi: 10.1111/jvs.12482. - DOI
    1. Socolar JB, Gilroy JJ, Kunin WE, Edwards DP. How should beta-diversity inform biodiversity conservation? Trends Ecol. Evol. 2016;31:67–80. doi: 10.1016/j.tree.2015.11.005. - DOI - PubMed
    1. Xing DL, He FL. Environmental filtering explains a U-shape latitudinal pattern in regional beta-deviation for eastern North American trees. Ecol. Lett. 2019;22:284–291. doi: 10.1111/ele.13188. - DOI - PubMed
    1. Anderson MJ, et al. Navigating the multiple meanings of beta diversity: a roadmap for the practicing ecologist. Ecol. Lett. 2011;14:19–28. doi: 10.1111/j.1461-0248.2010.01552.x. - DOI - PubMed
    1. Baselga A. Partitioning the turnover and nestedness components of beta diversity. Glob. Ecol. Biogeogr. 2010;19:134–143. doi: 10.1111/j.1466-8238.2009.00490.x. - DOI

Publication types