. 2021 May 25;12(1):3108.
doi: 10.1038/s41467-021-23363-x.

Sulfide catabolism ameliorates hypoxic brain injury

Affiliations

Sulfide catabolism ameliorates hypoxic brain injury

Eizo Marutani et al. Nat Commun. .

Abstract

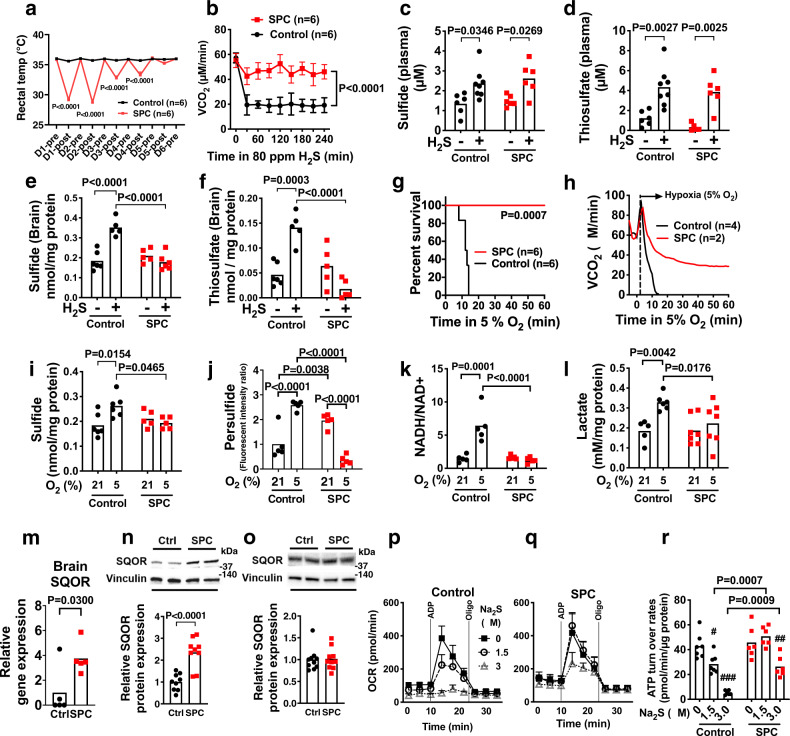
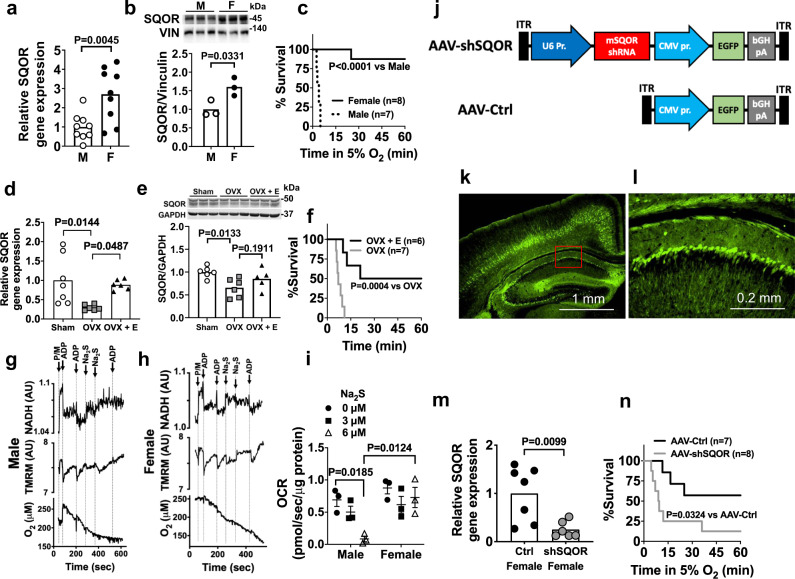
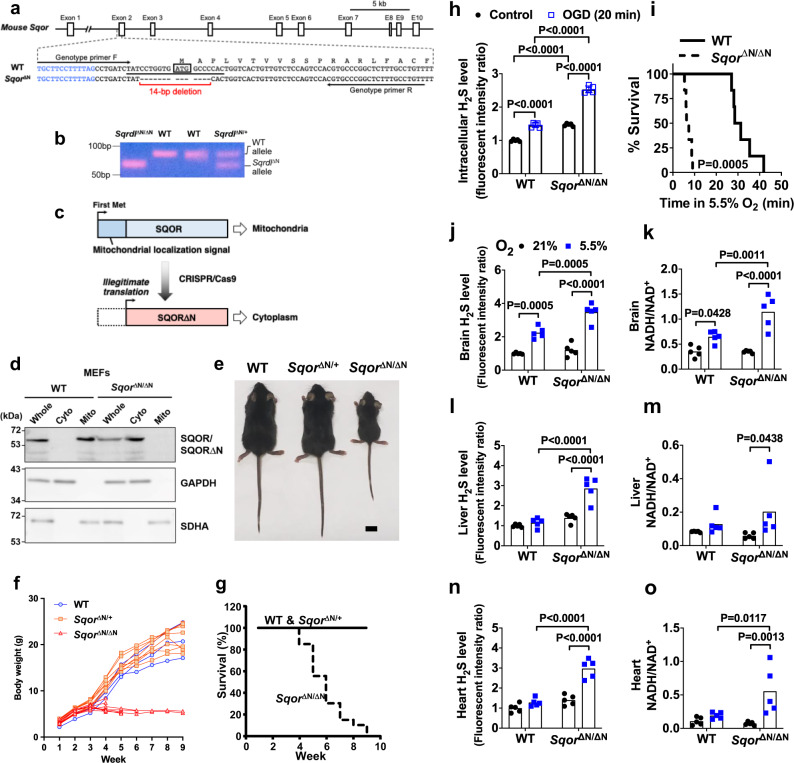
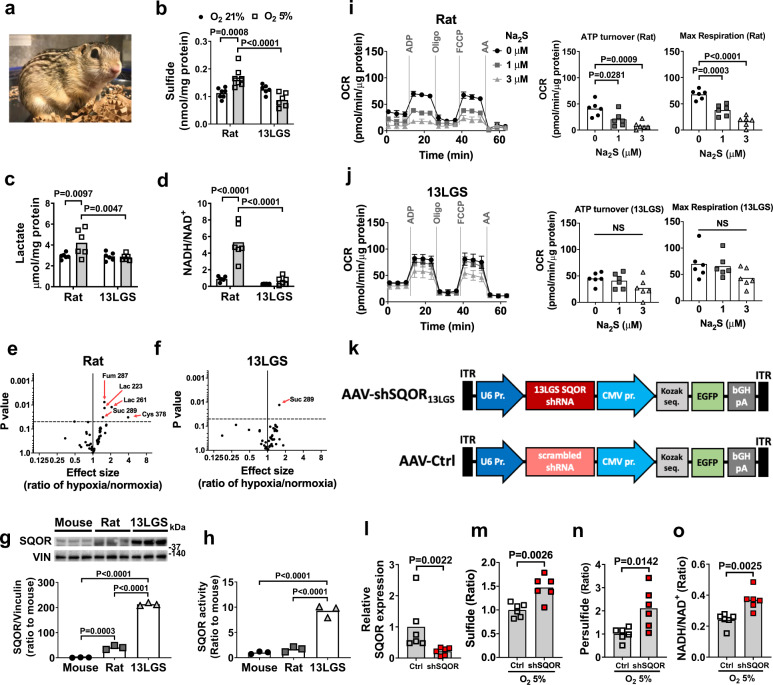
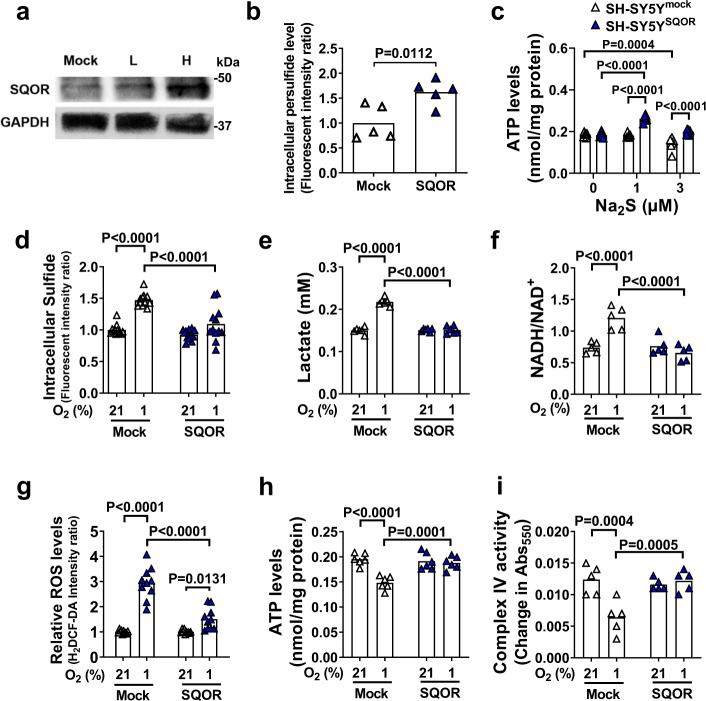
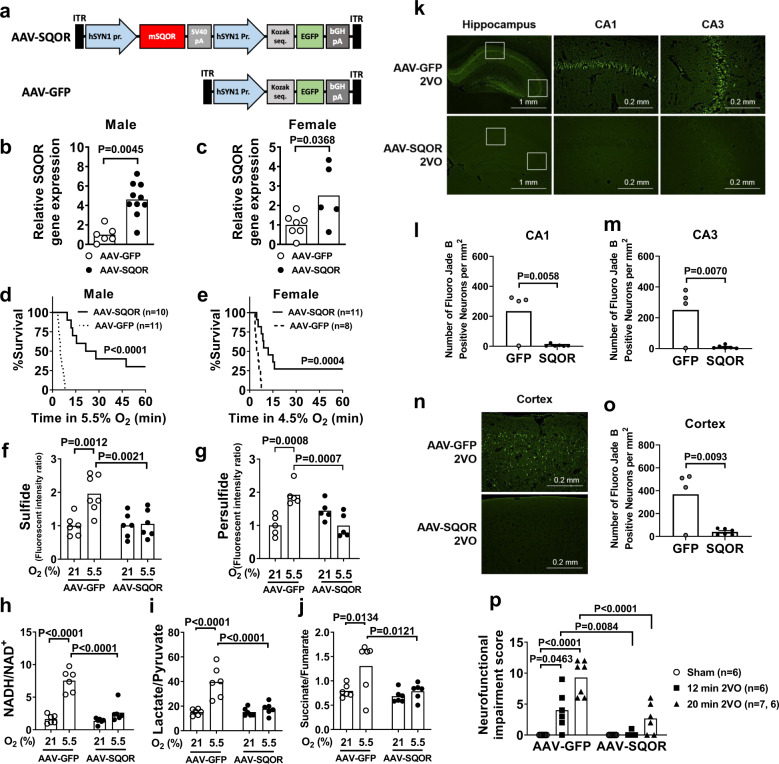
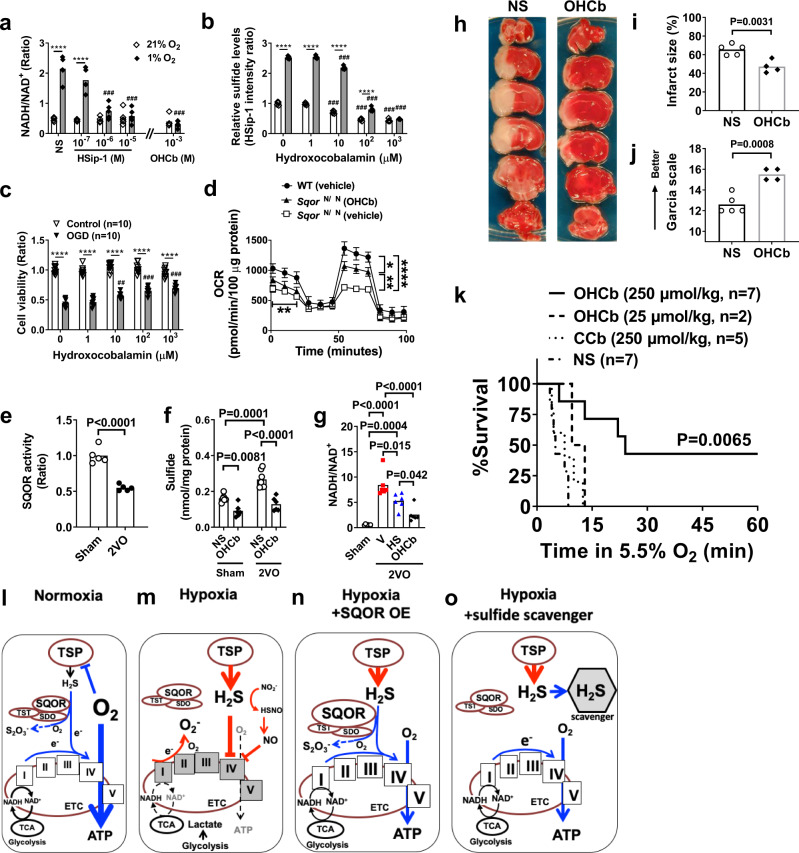
The mammalian brain is highly vulnerable to oxygen deprivation, yet the mechanism underlying the brain's sensitivity to hypoxia is incompletely understood. Hypoxia induces accumulation of hydrogen sulfide, a gas that inhibits mitochondrial respiration. Here, we show that, in mice, rats, and naturally hypoxia-tolerant ground squirrels, the sensitivity of the brain to hypoxia is inversely related to the levels of sulfide:quinone oxidoreductase (SQOR) and the capacity to catabolize sulfide. Silencing SQOR increased the sensitivity of the brain to hypoxia, whereas neuron-specific SQOR expression prevented hypoxia-induced sulfide accumulation, bioenergetic failure, and ischemic brain injury. Excluding SQOR from mitochondria increased sensitivity to hypoxia not only in the brain but also in heart and liver. Pharmacological scavenging of sulfide maintained mitochondrial respiration in hypoxic neurons and made mice resistant to hypoxia. These results illuminate the critical role of sulfide catabolism in energy homeostasis during hypoxia and identify a therapeutic target for ischemic brain injury.


Conflict of interest statement

The authors declare no competing interests.

Figures

Fig. 1
Fig. 1. Effects of sulfide pre-conditioning on sulfide metabolism and hypoxia tolerance in mice.
a Body temperature of control and sulfide pre-conditioned (SPC) mice. “Pre” and “post” time points depict mice before and after breathing air (control) or H2S at 80 ppm for 4 h, respectively, from day 1 (D1) to day 6 (D6). b Whole-body CO2 production rate (VCO2) of SPC and control mice during H2S breathing on the 6th day after starting SPC or control air breathing. Concentration of c sulfide (from left to right, n = 6, 8, 6, 6) and d thiosulfate (n = 6, 8, 6, 6) in plasma and concentrations of e sulfide (n = 6 each) and f thiosulfate (n = 6 each) in the brain of SPC and control mice during H2S or air breathing on the 6th day. g Survival rate and h VCO2 of mice breathing 5% O2 on the 6th day in control or SPC mice. Brain levels of i sulfide (n = 6, 6, 5, 5), j persulfide (n = 5 each), k NADH/NAD+ ratio (n = 5 each), and l lactate levels (n = 5, 6, 7, 7) in control and SPC mice breathing at FiO2 = 21% or 5% on the 6th day. m Relative mRNA levels of SQOR in the brain of SPC and control mice (normalized as control = 1). n = 5 each. SQOR protein levels in n the brain tissue extracts (n = 9 each) and in o the heart (n = 10 each) from control and SPC mice. Oxygen consumption rate (OCR) of isolated brain mitochondria from p control (n = 7) and q SPC (n = 6) mice with or without incubation with sulfide (Na2S, 0, 1.5, 3.0 µM) and r calculated ATP turnover rates (n = 7, 7, 7, 6, 6, 6). Data are presented as mean ± SEM or mean and individual values. #P < 0.05, ##P < 0.01, ###P < 0.001 vs Na2S at 0 µM of respective group. Two-way ANOVA followed by Sidak’s or Tukey’s correction for post-hoc comparisons were performed for af, il, and r. Survival rates were estimated using the Kaplan–Meier method and a log-rank test was used to compare the survival curves between groups in g. A two-tailed unpaired t-test was performed for mo.
Fig. 2
Fig. 2. Sexual dimorphism of SQOR expression in the brain.
a Relative SQOR mRNA levels (n = 9 each) and b protein levels (n = 3 each) in male and female CD-1 mice. Vin, vinculin. c Survival curve of male and female CD-1 mice breathing 5% oxygen. Effects of ovariectomy (OVX) and 17 beta-estradial (E) replacement on d SQOR mRNA levels (n = 7, 6, 6) and e protein levels (n = 6, 5, 5) in the brain and f survival rate in hypoxia (5% O2) in female CD-1 mice. Impact of sulfide (Na2S) on ADP-induced changes in NADH levels, mitochondrial membrane potential (TMRM, tetramethylrhodamine methylester), and oxygen consumption rates (OCR) in suspensions of isolated brain mitochondria from g male and h female WT mice. P/M, pyruvate/malate. Representative traces of three independent experiments in each genotype. i Summary of OCR values in response to ADP before and after administration of sulfide (Na2S, 0, 3, 6 µM) in experiments represented in g and h. n = 3 at each Na2S dose. j Structure of AAV containing shRNA against mouse SQOR (AAV-shSQOR) under a U6 promoter for RNA polymerase III and control AAV (AAV-Ctrl). ITR, inverted terminal repeat, EGFP, enhanced green fluorescent protein, CMV, cytomegalovirus, bGH, bovine growth hormone. k, l Representative immunofluorescence images of the brain sections of CD-1 mice stained with an anti-GFP antibody 8 weeks after injection of AAV-Ctrl into ICV. Image in l shows a blow-up of a part of the image in k enclosed in a red box. n = 2 biologically independent experiments. m Relative SQOR mRNA levels in the brains of female CD-1 mice transfected with AAV-Ctrl or AAV-shSQOR (n = 7, 6). n Survival curve of adult female CD-1 mice infected with AAV-Ctrl or AAV-shSQOR breathing 5% oxygen. Data are presented as mean ± SEM or mean and individual values. A two-tailed unpaired t-test was performed for a, b, and m. Survival rates were estimated using the Kaplan–Meier method and a log-rank test was used to compare the survival curves between groups in c, f, and n. One-way or two-way ANOVA followed by Dunnett’s or Tukey’s correction for post-hoc comparisons were performed for d, e, and i.
Fig. 3
Fig. 3. Generation of SQOR mutant mice and their increased sensitivity to hypoxia.
a Schematic illustration of the murine Sqor gene structure and sequences of WT and mutant alleles spanning the translation initiation codon. Blue letters and black letters indicate the first intron and the second exon, respectively. ATG enclosed by a box indicates the first methionine codon. A target sequence of gRNA is underlined. Target sequences for genotyping primers are indicated by arrows. b PCR detection of a deletion in the Sqor gene. Genomic DNAs from WT, Sqor∆N/+, and Sqor∆N/∆N mice were amplified with a primer set shown in a. Representative PCR gel images of 3 independent biological replicates of each are shown. c Schematic presentation of SQOR proteins expressed by WT and Sqor∆N alleles. d Immunoblot analysis of whole-cell lysates (Whole) and cytosolic (Cyto) and mitochondrial (Mito) fractions of MEFs established from WT and Sqor∆N/∆N embryos. Representative immunoblots of 3 independent biological replicates for each are shown. Protein samples were prepared for detection of SQOR, GAPDH (cytosolic marker), and SDHA (mitochondrial marker). e Macroscopic appearance of 5-week-old WT, Sqor∆N/+, and Sqor∆N/∆N littermate male mice. Scale bar, 1 cm. Representative images of more than three of each genotype are shown. f Body weight gain and g survival rate of Sqor∆N/∆N mice (n = 20) compared with Sqor∆N/+ mice and WT mice (n = 70). h Relative intracellular H2S levels of primary cortical neurons obtained and cultured from SqorΔN/ΔN mice and their wild-type littermates embryos subjected to oxygen-glucose deprivation (OGD). i Survival curve of SqorΔN/ΔN mice and their wild-type littermates breathing 5.5% oxygen. Relative levels of sulfide in j, l, n and the ratio of NADH/NAD+ in k, m, o in the brain, liver, or heart, respectively, of SqorΔN/ΔN mice and their wild-type littermates breathing 5.5% oxygen (N = 5 each). Data are presented as mean and individual values. Two-way ANOVA followed by Tukey’s correction for post-hoc comparisons were performed for h and jl, n, and o. Survival rates were estimated using the Kaplan–Meier method and a log-rank test was used to compare the survival curves between groups in i. Kruskal–Wallis test followed by Dunn’s multiple comparisons was performed for m.
Fig. 4
Fig. 4. Hypoxia tolerance and enhanced sulfide catabolism in 13-lined ground squirrels.
a 13 lined ground squirrel. Levels of b sulfide (n = 7, 7, 6, 6), c lactate (n = 6 each), and d NADH/NAD+ ratio (n = 6 each) in brains of rats and 13LG squirrels (13 LGS) breathing 21% or 5% oxygen for 5 min under isoflurane anesthesia. Volcano plots showing the changes in whole-brain metabolite profiles in response to breathing 5% oxygen in e rats and f 13LG squirrels. Lac, lactate; Cys, cysteine; Fum, fumarate; Suc, succinate. g Immunoblots and protein expression levels of SQOR in forebrains of mouse, rat, and 13LG squirrel (N = 3 each). h SQOR enzyme activity in forebrains in mouse, rat, and 13LG squirrel (N = 6 each). ATP turnover rate and maximal respiratory rate of isolated brain mitochondria measured as oxygen consumption rate (OCR) in i rats and j 13LG squirrels incubated with 0, 1, or 3 μM of Na2S (n = 6 each). k Structure of AAV containing shRNA against 13LG squirrel SQOR (AAV-shSQOR13LGS) under a U6 promoter for RNA polymerase III and control AAV (AAV-Ctrl) containing scrambled shRNA. l Relative SQOR mRNA levels in the brain of 13LG squirrels infected with AAV-Ctrl (Control) or AAV-shSQOR13LGS (shSQOR). Relative levels of m sulfide and n persulfide and o the ratio of NADH/NAD+ in the brains of Control or shSQOR-infected 13LG squirrels breathing 5% oxygen under anesthesia. n = 6 each. Data are presented as mean ± SEM or mean and individual values. Two-way or one-way ANOVA followed by Sidak’s correction for post-hoc comparisons were performed for bd and gj. Volcano plots were created using values in Supplementary Table S1 and S2. A two-tailed unpaired t-test was performed for l, n, and o. Mann–Whitney U test was performed for m.
Fig. 5
Fig. 5. SQOR improves mitochondrial function in neuronal cells.
a Immunoblots of SQOR in SH-SY5Y with mock transfection or SQOR expression (L, H: low and high dose of transfection agent). Representative immunoblots of 2 independent biological replicates are shown. b Effect of SQOR expression on Intracellular persulfide level in SH-SY5Y cell at 21% O2. n = 5 each. c ATP levels in mitochondria isolated from SH-SY5Y cells with or without SQOR expression treated with Na2S at 0, 1, or 3 µM in the medium (n = 6 each). d Intracellular H2S (n = 12 each), e lactate in cell culture medium (n = 6 each), f intracellular NADH/NAD+ ratio (n = 5 each), g intracellular ROS (n = 10 each), h intracellular ATP (n = 6 each), and i complex IV activity (n = 5 each) in SH-SY5Y cells with or without SQOR expression in 21% or 1% O2. Cells were exposed to hypoxia or normoxia for 3 h starting at 48 h after transfection. Data are presented as mean and individual values. A two-tailed unpaired t-test was performed for b. Two-way ANOVA followed by Sidak’s correction for post-hoc comparisons were performed for ci.
Fig. 6
Fig. 6. Effects of SQOR expression in the brain of mice.
a Structures of AAV containing mouse SQOR and enhanced GFP sequence under hSYN1 promoter (AAV-SQOR) and control AAV (AAV-GFP). SV40, simian virus 40. Relative SQOR mRNA expression levels in brains of 8-week-old b male (n = 6, 10) and c female (n = 7, 5) CD-1 mice transfected with AAV-GFP or AAV-SQOR on postnatal day 0. Survival curves of 8-week-old d male and e female CD-1 mice transfected with AAV-GFP or AAV-SQOR on postnatal day 0 and breathing 5.5% oxygen and 4.5% oxygen, respectively. Levels of f sulfide (n = 6, 7, 6, 6), g persulfide (n = 5 each), h the ratios of NADH/NAD+ (n = 6 each), i lactate/pyruvate (n = 6 each), and j succinate/fumarate (n = 6 each) in male mice transfected with AAV-GFP or AAV-SQOR and breathed 21% or 5.5% oxygen for 3 min. k Representative photomicrographs of Fluoro-Jade B (FJB)-stained brain sections focusing on hippocampal CA1 and CA3 regions of male mice transfected with AAV-GFP (n = 4) or AAV-SQOR (n = 6) and subjected to 2VO and reperfusion. Number of dead neurons in l CA1 and m CA3 regions of mice transfected with AAV-GFP or AAV-SQOR and subjected to 2VO (n = 4, 6). n Representative photomicrographs of FJB-stained brain sections focusing on cerebral cortex region of male mice transfected with AAV-GFP (n = 4) or AAV-SQOR (n = 6) and subjected to 2VO and reperfusion. o Number of dead neurons in the cerebral cortex of mice transfected with AAV-GFP or AAV-SQOR and subjected to 2VO (n = 4, 6). p Neurofunctional impairment score of male CD-1 mice transfected with AAV-GFP or AAV-SQOR and subjected to sham surgery or 12 or 20 min of 2VO (n = 6, 6, 7, 6, 6, 7). Data are presented as mean and individual values. A two-tailed unpaired t-test was performed for b, c, l, m, and o. Survival rates were estimated using the Kaplan–Meier method and a log-rank test was used to compare the survival curves between groups in d and e. Two-way ANOVA followed by Sidak’s correction for post-hoc comparisons were performed for fj and p.
Fig. 7
Fig. 7. Effects of sulfide scavenger.
a NADH/NAD+ ratio in SH-SY5Y cell lysates 3 h after incubation in hypoxia or normoxia with varying doses of HSip-1 or hydroxocobalamin (OHCb). n = 5 each. ***P < 0.001 vs normal saline (NS) at nomoxia. ###P < 0.001 vs NS at hypoxia. b Relative sulfide levels in SH-SY5Y incubated in normoxia or hypoxia in the presence of varying concentrations of OHCb. n = 5 each. c Cell viability of SH-SY5Y subjected to oxygen and glucose deprivation (OGD) in the presence of varying levels of OHCb, assessed by crystal violet assay. n = 10 each. ***P < 0.001, ##, ###P < 0.1, 0.001 vs OHCb 0 μM. d Oxygen consumption rate (OCR) was measured in isolated brain mitochondria from SqorΔN/ΔN mice with or without OHCb and compared to isolated mitochondria of wild-type littermates treated with vehicle (n = 4 each). e SQOR activity (n = 5 each) and f sulfide levels (n = 6, 6, 7, 6) in the brains of mice subjected to sham operation or 2VO and treated with saline or OHCb. g NADH/NAD+ ratio in the brains of sham-operated mice or in mice 5 min after the start of 2VO treated with vehicle (V), HSip-1 (HS), or OHCb (n = 6 each). h Representative photographs of the TTC staining of coronal brain sections of male mice subjected to permanent MCAO and treated with normal saline (NS) or OHCb. i Brain infarct volume and j neurologic function in male mice after 2VO and reperfusion (n = 5, 4). k Survival curve of male CD-1 mice treated with OHCb, cyanocobalamin (CCb), or normal saline breathing 5.5% oxygen. Diagram illustrating working hypothesis on the role of SQOR and sulfide on mitochondrial energy production during l normoxia, m hypoxia, n hypoxia with SQOR expression, and o hypoxia with sulfide scavenger. TSP, transsulfuration pathway. TST, thiosulfate sulfurtransferase. ETHE1, ethylmalonic encephalopathy 1. TCA, tricarboxylic acid cycle, or Krebs cycle. Mitochondrial electron transport chain (ETC) complex are shown with roman numerals in boxes. Data are presented as mean and individual values. Two-way ANOVA followed by Tukey’s or Sidak’s correction for post-hoc comparisons were performed for ad and f. Two-tailed unpaired t-test was performed for e, i, and j. One-way ANOVA followed by Tukey’s correction for post-hoc comparisons were performed for g. Survival rates were estimated using the Kaplan–Meier method and a log-rank test was used to compare the survival curves between groups in k.

Similar articles

Cited by

References

    1. Kristian T. Metabolic stages, mitochondria and calcium in hypoxic/ischemic brain damage. Cell Calcium. 2004;36:221–233. doi: 10.1016/j.ceca.2004.02.016. - DOI - PubMed
    1. Erecinska M, Silver IA. ATP and brain function. J. Cereb. Blood Flow. Metab. 1989;9:2–19. doi: 10.1038/jcbfm.1989.2. - DOI - PubMed
    1. Erecinska M, Silver IA. Ions and energy in mammalian brain. Prog. Neurobiol. 1994;43:37–71. doi: 10.1016/0301-0082(94)90015-9. - DOI - PubMed
    1. Kalogeris T, Baines CP, Krenz M, Korthuis RJ. Cell biology of ischemia/reperfusion injury. Int. Rev. Cell Mol. Biol. 2012;298:229–317. doi: 10.1016/B978-0-12-394309-5.00006-7. - DOI - PMC - PubMed
    1. Erecinska M, Silver IA. Tissue oxygen tension and brain sensitivity to hypoxia. Respir. Physiol. 2001;128:263–276. doi: 10.1016/S0034-5687(01)00306-1. - DOI - PubMed

Publication types

MeSH terms