. 2021 May 25;12(1):3098.
doi: 10.1038/s41467-021-23337-z.

Non-productive angiogenesis disassembles Aß plaque-associated blood vessels

Affiliations

Non-productive angiogenesis disassembles Aß plaque-associated blood vessels

Maria I Alvarez-Vergara et al. Nat Commun. .

Abstract

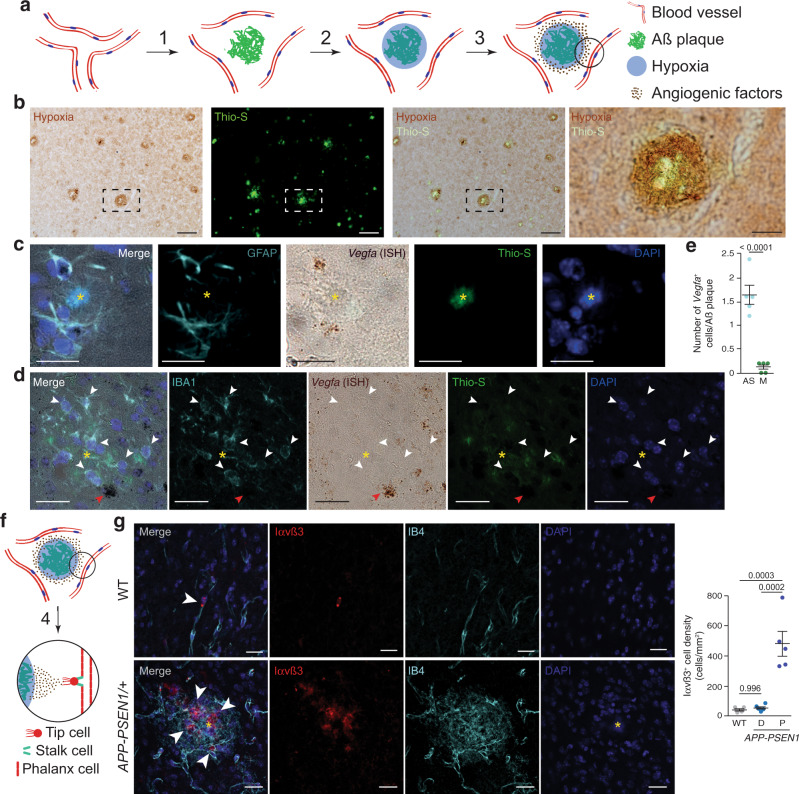
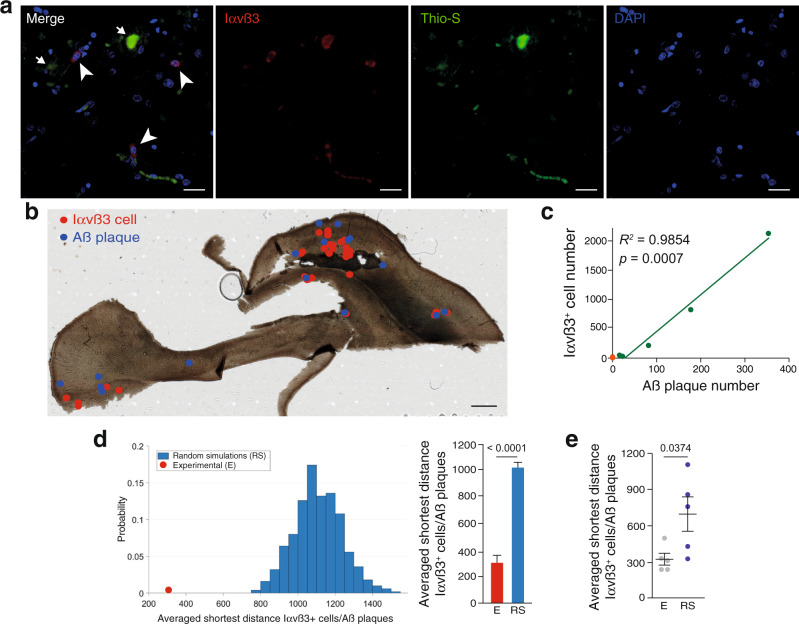
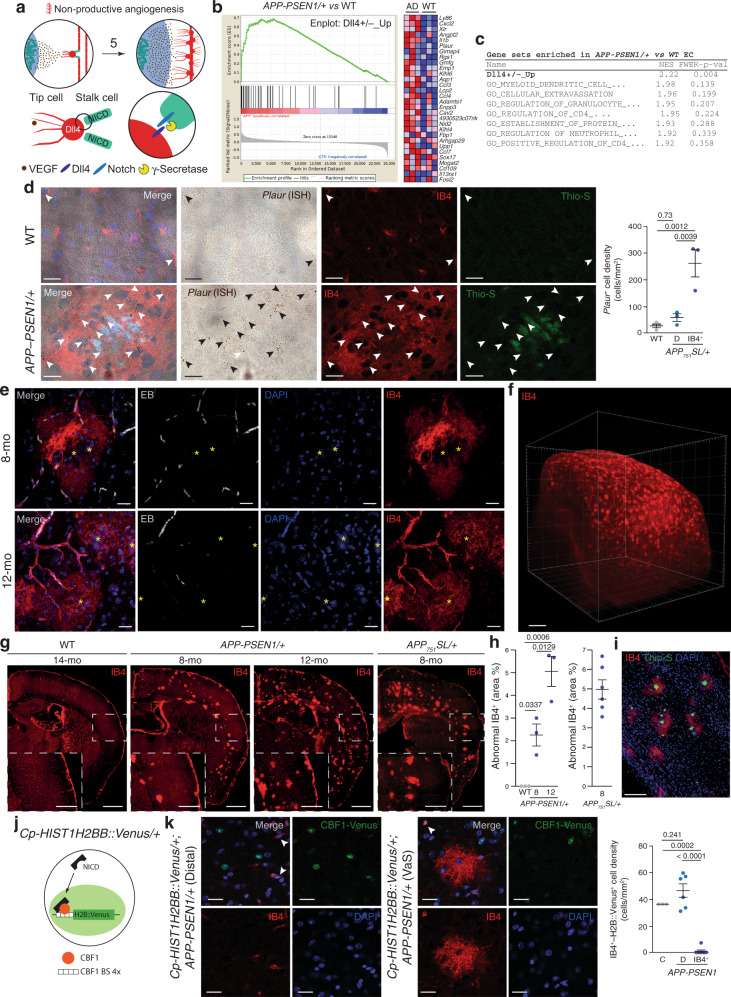
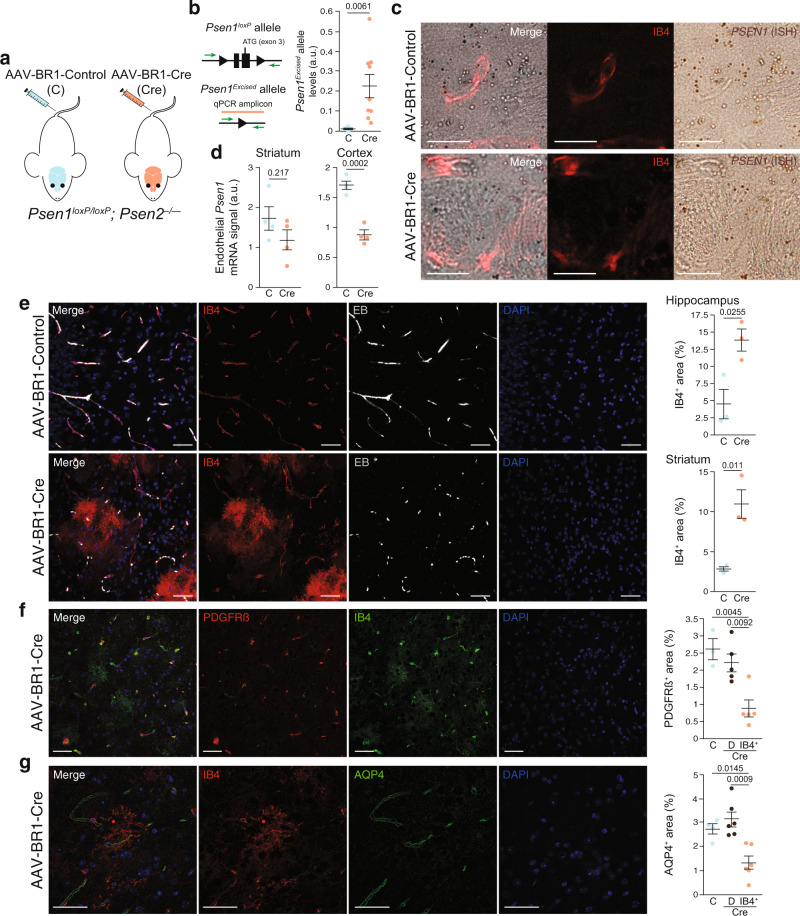
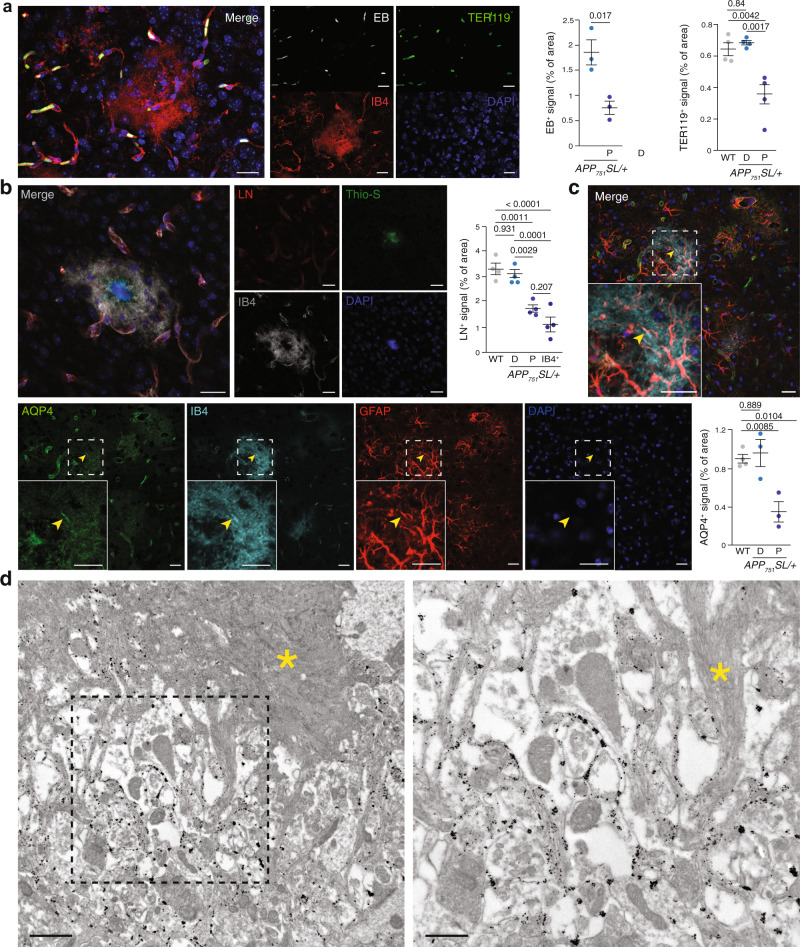
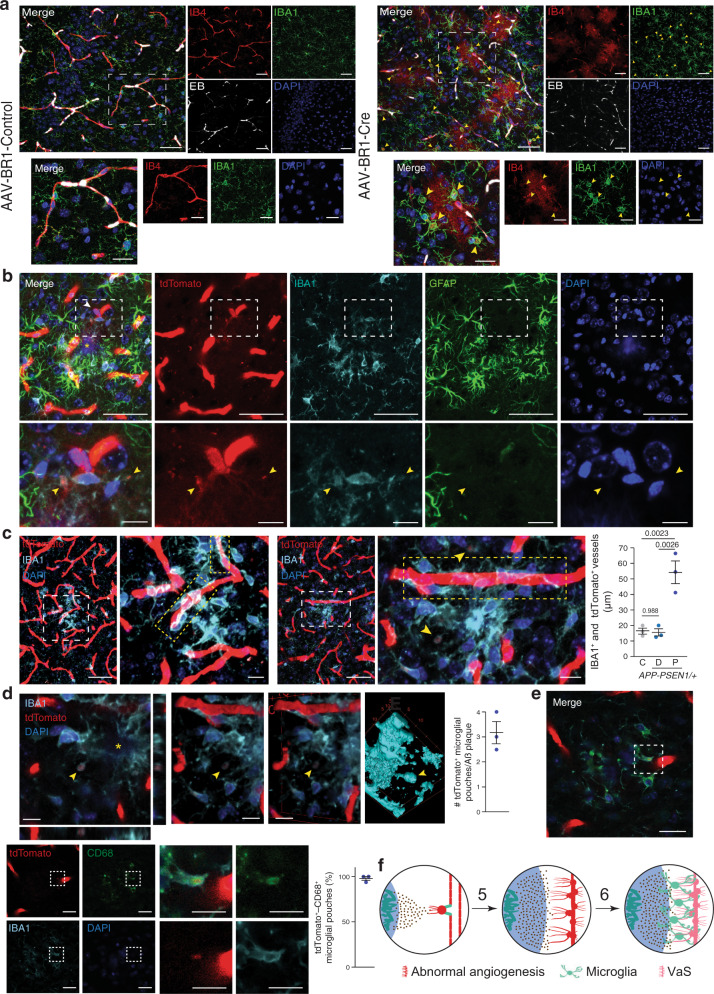
The human Alzheimer's disease (AD) brain accumulates angiogenic markers but paradoxically, the cerebral microvasculature is reduced around Aß plaques. Here we demonstrate that angiogenesis is started near Aß plaques in both AD mouse models and human AD samples. However, endothelial cells express the molecular signature of non-productive angiogenesis (NPA) and accumulate, around Aß plaques, a tip cell marker and IB4 reactive vascular anomalies with reduced NOTCH activity. Notably, NPA induction by endothelial loss of presenilin, whose mutations cause familial AD and which activity has been shown to decrease with age, produced a similar vascular phenotype in the absence of Aß pathology. We also show that Aß plaque-associated NPA locally disassembles blood vessels, leaving behind vascular scars, and that microglial phagocytosis contributes to the local loss of endothelial cells. These results define the role of NPA and microglia in local blood vessel disassembly and highlight the vascular component of presenilin loss of function in AD.


Conflict of interest statement

The authors declare no competing interests.

Figures

Fig. 1
Fig. 1. Angiogenesis is concentrated around Aß plaques in AD mouse models.
a Working model of the angiogenesis around Aß plaques. Aß deposition separate vessels (1) producing local hypoxia (2) and inducing angiogenic factors expression (3). b Coronal cortical sections of 14-month-old APP-PSEN1/+ mice treated with Hypoxiprobe (Pimonidazole HCl; 60 mg/kg i.p.; 45 min) showing hypoxia (brown, immunoperoxidase, DAB) in the vicinity of Aß plaques (green, Thioflavin-S staining –Thio-S–). The dashed square box is shown in the rightest panel. Scale bar = 100 and 25 µm, respectively, in low and high magnification images. c, d Vegfa is mainly expressed by astrocytes around Aß plaques in 8-month-old APP-PSEN1/+ mice. Aß plaques are indicated by a yellow asterisk. Cortical confocal XY images stained with astrocytic (GFAP; cyan; c), Vegfa (in situ hybridization, ISH; brown), Aß (Thio-S; green), microglial (IBA1; cyan, d), and nuclear (DAPI; blue) markers. White arrowheads indicate microglial cells without Vegfa expression and red arrowheads point to a non-microglial Vegfa-expressing cell (d). Scale bars (c, d) = 20 µm. e Quantification of the number of astrocytes (AS) and microglia (M) expressing Vegfa mRNA per Aß plaque. Mean ± SEM. n = 5 mice (5 Aß plaques per mice); Student’s t-test. f VEGF differentiates phalanx cells to tip cells that extrude from the vessel and stalk cells that will produce the new capillary (4). g A cortical mouse brain area stained with angiogenic endothelial (Integrin αvß3 –Iαvß3–; red), microglial (IBA1; green), endothelial (IB4; white), and nuclear (DAPI; blue) markers. Scale bar = 20 µm. Right graph, quantification of the Iαvß3+ cell density in 8-month-old wild-type (WT) and APP-PSEN1/+ mice. Mean ± SEM. n = 4 WT and 5 APP-PSEN1/+ mice; ANOVA, post hoc Tukey’s test.
Fig. 2
Fig. 2. Angiogenesis is concentrated around Aß plaques in AD.
a A human hippocampal brain slice stained with angiogenic endothelial (Iαvß3; red), Aß (Thio-S; green), and nuclear (DAPI; blue) markers. Scale bar = 20 µm. Arrowheads indicate angiogenic cells and arrows signal Aß plaques. b A human hippocampal brain slice where the position of Iαvß3+ cells (red dots) and Aß plaques (blue dots) are indicated. Scale bar = 1 mm. c Correlation between Iαvß3+ cells and the number of Aß plaques in five AD (Braak IV–VI) cases (green dots). The number of Iαvß3+ cells is also indicated for six control (Braak 0–I) human samples (orange dots). Spearman r correlation. d Left graph, representation of the probability of the averaged shortest distance between Iαvß3+ cells and Aß plaques in 500 random simulations (RS, blue bars) where the Aß plaques position was fixed and the Iαvß3+ cells’ location was randomized. The red dot represents the experimental measurement. Right graph, quantification of the shortest geodesic distance between Iαvß3+ cells and Aß plaques in an experimental (E) and in the first 10 random simulations (RS). Data are presented as mean ± SEM. n = 28 (E) and 280 (RS) Iαvß3+ cells and 16 Aß plaques. Student’s t-test. e Quantification of the averaged shortest geodesic distance between Iαvß3+ cells and Aß plaques from experimental (E) human brain slices and 500 random simulations (RS) of Iαvß3+ cells location. Mean ± SEM. n = 5 human samples; Student’s t-test.
Fig. 3
Fig. 3. Angiogenesis is non-productive around Aß plaques.
a Working model of the angiogenesis around Aß plaques. Numeration continues from Fig. 1f. Upper row: Non-productive angiogenesis will convert phalanx cells to non-conducting tip cells, extending local hypoxia (5). Lower row: γ-secretase activity is involved in the lateral inhibition process that controls tip-stalk cell identity. b, c Gene set enrichment analysis (GSEA) revealed that Dll4+/–_Up GS is highly represented in 18-month-old APP-PSEN1/+ versus WT endothelial cell differential transcriptomic (b, left panel). Right panel (b) shows the heat map of the top 30 ranking leading edge genes included in the Dll4+/–_Up GS. Red symbolizes overexpression and blue down regulation. The table includes the eight top-enriched GSs (c), FEWER p val (values) were two-sided and adjusted for multiple comparisons. d Cortical confocal XY images from 8-month-old APP-PSEN1/+ and stained with endothelial (IB4; red), Plaur (ISH; brown), Aß (Thio-S; green), and nuclear (DAPI; blue) markers. Arrowheads indicate reactive cells expressing Plaur. Scale bar = 20 µm. Right graph shows the quantification of Plaur+ cells/mm2 in WT (gray dots) and distal to Aß plaques (D; light blue dots) and IB4+ regions (IB4+; blue dots) in the APP-PSEN1/+ mouse model. Mean ± SEM. n = 4 WT and 3 APP-PSEN1/+ mice; ANOVA, post hoc Tukey’s test. e Cortical confocal projection from 8- (upper row) and 12- (lower row) month-old APP-PSEN1/+ mice injected with Evans Blue (EB, white) and stained with endothelial (IB4; red) and nuclear (DAPI; blue) markers. Aß plaques are indicated with a yellow asterisk. Scale bar = 20 µm. f Full hemi-cortex from a 10-month-old APP-PSEN1/+ mouse stained to visualize endothelial cells (IB4; red) and rendered transparent using iDISCO. Scale bar = 500 µm. g Superimages of brain cortical sections from WT, APP-PSEN1/+, and APP751SL/+ mice stained to label endothelial cells (IB4; red). Insets show the white square from low magnification images. Scale bar = 1 mm in low and 500 µm in high magnification images. h Quantification of the percentage of cortical surface occupied by abnormal IB4+ staining. Mean ± SEM. n = 3 8-month-old WT and APP-PSEN1/+; and 12-month-old APP-PSEN1/+; and 6 APP751SL/+ mice; ANOVA, post hoc Tukey’s test. i Image of a cortical slice from 8-month-old APP-PSEN1/+ mice stained with endothelial (IB4; red), Aß (Thio-S; green), and nuclear (DAPI; blue) markers. Scale bar = 100 µm. j Schematic representation of the Cp-HIST1H2BB::Venus/+ mouse model. NICD NOTCH intracellular domain, CBF1 BS CBF1-binding sites. k Left images: coronal cortical sections from Cp-HIST1H2BB::Venus/+; APP-PSEN1/+ mice distal (left) and proximal (right) to Aß plaques and stained with endothelial (IB4; red), and nuclear (DAPI; blue) markers. Green: Direct visualization of H2BB::Venus fluorescence. Scale bar = 20 µm. Right graph, quantification of the number of H2BB::Venus positive endothelial cells in Cp-HIST1H2BB::Venus/+; +/+ (Control, C), Cp-HIST1H2BB::Venus/+; APP-PSEN1/+ distal (D) and IB4+ proximal (P) to Aß plaques. Mean ± SEM. n = 3 Cp-HIST1H2BB::Venus/+; +/+ and 6 Cp-HIST1H2BB::Venus/+; APP-PSEN1/+ mice; ANOVA, post hoc Tukey’s test.
Fig. 4
Fig. 4. In adult inhibition of endothelial γ-secretase activity is sufficient to generate IB4+ vascular abnormalities.
a Schematic representation of a mouse model with adult inhibition of endothelial γ-secretase activity. Psen1loxP/loxP; Psen2–/– mice were injected with cerebral endothelium-specific adeno-associated control (AAV-BR1-Control; C) or Cre recombinase-expressing (AAV-BR1-Cre; Cre) viruses. b Schematic representation of the qPCR amplicon used to detect the Psen1 excised allele (orange bar). Right graph: Quantification of the degree of Psen1 excision (a.u., arbitrarty units) in the striatum of C and Cre mice. Mean ± SEM. n = 3 C and 10 Cre mice; Student’s t-test. c Striatal confocal XY images from C and Cre mice stained with endothelial (IB4; red) and Psen1 (ISH; brown) markers. Scale bar = 20 µm. d Quantification of endothelial Psen1+ signal in the striatum (left graph) and the cortex (right graph) of C and Cre mice. Mean ± SEM. n = 4 mice; Student’s t-test. eg Confocal projections of striatal (e) or hippocampal slices (f, g) from Psen1loxP/loxP; Psen2–/– mice injected with AAV-BR1-Control or AAV-BR1-Cre viral vectors, and, 2 months later, perfused with Evans blue (EB; white —e) and stained with endothelial (IB4; red —e, g— or green —f), pericyte (PDGFRß; red —f), astrocytic end-feet (AQP4; green —g), and nuclear (DAPI; blue) markers. Scale bars = 40 µm. Right graphs are the quantification of: e percentage of area occupied by IB4+ in C and Cre mice in hippocampus (upper row) and striatum (lower row). Mean ± SEM. n = 3 mice; Student’s t-test. f, g Percentage of area occupied by PDGFRß+ (f) or AQP4+ (g) signal (in distal —D— vessels and in IB4+ area) in hippocampus form C and Cre mice. Mean ± SEM. n f = 3 C and 5 Cre mice; n g = 4 C and 6 Cre mice ANOVA, post hoc Tukey’s test.
Fig. 5
Fig. 5. Vessels are substituted by vascular scars proximal to Aß plaques.
a Left panels, cortical confocal XY images from 8-month-old APP751SL/+ mice stained with endothelial (IB4; red), red cells (TER119; green), Evens Blue (EB, white), and nuclear (DAPI; blue) markers. Scale bar = 20 µm. Right graphs, left, quantification of the EB vessel area distal (D) and proximal (P) to Aß plaques. Mean ± SEM. n = 3 mice; Student’s t-test; right, quantification of the TER119 vessel area in WT, distal (D), and proximal (P) to Aß plaques in APP751SL/+ mice. Mean ± SEM. n = 4 mice; ANOVA, post hoc Tukey’s test. b Left panels, cortical confocal XY images 8-month-old APP751SL/+ mice stained with vessel basement membrane (laminin, LN; red), endothelial (IB4; white), Aß (Thio-S; green), and nuclear (DAPI; blue) markers. Scale bar = 20 µm. Right graphs, quantification of the laminin vessel area in WT mice, in distal (D), proximal (P) to Aß plaques, and inside the IB4+ vascular abnormal structures (IB4+) in 8-month-old APP751SL/+ mice. Mean ± SEM. n = 4 mice; ANOVA, post hoc Tukey’s test. c Cortical confocal projection 8-month-old APP751SL/+ mice stained with astrocytic end-feet (aquaporin 4, AQP4; green), endothelial (IB4; cyan), astrocytic (GFAP, red), and nuclear (DAPI; blue) markers. Insets show the white square from low magnification images. Yellow arrowheads indicate an astrocytic end-feet juxtaposed to an IB4+ structure. Scale bar = 20 µm. Lower graph, left, quantification of the EB vessel area distal (D) and proximal (P) to Aß plaques. Mean ± SEM. n = 4 WT and 3 APP751SL/+ mice; ANOVA, post hoc Tukey’s test. d Electron microscopy analysis of an 8-month-old APP751SL/+ cortex stained with IB4 (black dots, gold particles). Right image is a high magnification of the left dashed square shown in the left panel. A yellow asterisk indicates an Aß plaque. Scale bar = 1 µm in low and 0.5 µm in high magnification images.
Fig. 6
Fig. 6. Microglial cells phagocyte VaS-associated blood vessels.
a Striatal confocal XY images from Psen1loxP/loxP; Psen2–/– mice that were injected with cerebral endothelium-specific adeno-associated control (AAV-BR1-Control; C) or Cre recombinase-expressing (AAV-BR1-Cre; Cre) viruses, perfused with Evans blue (EB; white) and stained with endothelial (IB4; red), microglia (IBA1; green), nuclear (DAPI; blue) markers. Yellow arrowheads indicate microglial IB4+ pouches. Lower row images show the dashed white rectangles depicted in the upper row images. Scale bars = 20 and 10 µm in low and high magnification images. be Cortical confocal images 8-month-old Cdh5-Cre::ERT2/+; R26-LSL-tdTomato/+; APP-PSEN1/+ tamoxifen-treated mice and stained with a tdTomato antibody (b) or direct tdTomato fluorescence (ce) (red) and with microglial (IBA1; cyan), astrocytic (GFAP; green —b), lysosomal (CD68; green —e) and nuclear (DAPI; blue) markers. Aß plaques are indicated with a yellow asterisk. Yellow arrowheads indicate internalization of tdTomato+ signal by microglial pouches. Lower row images show the dashed white rectangles depicted in the upper row (b, e) or left (c) images. A white arrowhead indicates a tip cell that projects extensions towards an Aß plaque (b). Scale bars (be) = 50 µm in low and 10 µm in high magnification images. Regions with high alignment of endothelial cells and microglia are highlighted with dashed yellow rectangles in c. Left panel in d shows a z-projection of a magnified and cropped image from c showing the orthogonal projections and the right panels show different rotated views of 3D reconstructions of the left image (volume, two central panels; surface, right panel). Right graphs (ce) show the quantification of c the length of tdTomato+ vessels occupied by IBA1+ signal. Mean  ± SEM. n = 3 mice; ANOVA, post hoc Tukey’s test; d the number of microglial pouches proximal to Aß plaques. Mean ± SEM. n = 3 mice; and e the percentage of microglial IB4+/CD68+ pouches. Mean ± SEM. n = 3 mice. f Working model of the process of vascular scars (VaS) formation. Numeration continues from Fig. 1f.

References

    1. Querfurth HW, LaFerla FM. Alzheimer’s disease. N. Engl. J. Med. 2010;362:329–344. doi: 10.1056/NEJMra0909142. - DOI - PubMed
    1. Goate A, Hardy J. Twenty years of Alzheimer’s disease-causing mutations. J. Neurochem. 2012;120(Suppl):3–8. doi: 10.1111/j.1471-4159.2011.07575.x. - DOI - PubMed
    1. De Strooper B. Loss-of-function presenilin mutations in Alzheimer disease. Talking point on the role of presenilin mutations in Alzheimer disease. EMBO Rep. 2007;8:141–146. doi: 10.1038/sj.embor.7400897. - DOI - PMC - PubMed
    1. Shen J, Kelleher RJ. The presenilin hypothesis of Alzheimer’s disease: evidence for a loss-of-function pathogenic mechanism. Proc. Natl Acad. Sci. USA. 2007;104:403–409. doi: 10.1073/pnas.0608332104. - DOI - PMC - PubMed
    1. Livingston G, et al. Dementia prevention, intervention, and care. Lancet. 2017;390:2673–2734. doi: 10.1016/S0140-6736(17)31363-6. - DOI - PubMed

Publication types

MeSH terms

Substances