. 2021 May 25;12(1):3118.
doi: 10.1038/s41467-021-23404-5.

Impacts of social distancing policies on mobility and COVID-19 case growth in the US

Affiliations

Impacts of social distancing policies on mobility and COVID-19 case growth in the US

Gregory A Wellenius et al. Nat Commun. .

Abstract

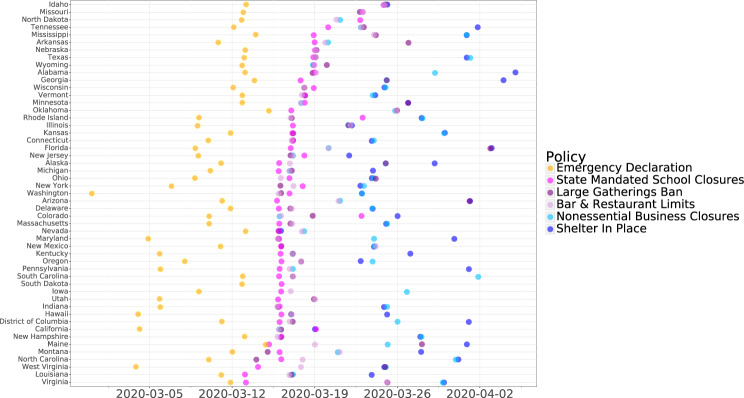
Social distancing remains an important strategy to combat the COVID-19 pandemic in the United States. However, the impacts of specific state-level policies on mobility and subsequent COVID-19 case trajectories have not been completely quantified. Using anonymized and aggregated mobility data from opted-in Google users, we found that state-level emergency declarations resulted in a 9.9% reduction in time spent away from places of residence. Implementation of one or more social distancing policies resulted in an additional 24.5% reduction in mobility the following week, and subsequent shelter-in-place mandates yielded an additional 29.0% reduction. Decreases in mobility were associated with substantial reductions in case growth two to four weeks later. For example, a 10% reduction in mobility was associated with a 17.5% reduction in case growth two weeks later. Given the continued reliance on social distancing policies to limit the spread of COVID-19, these results may be helpful to public health officials trying to balance infection control with the economic and social consequences of these policies.


Conflict of interest statement

The authors declare no competing interests.

Figures

Fig. 1
Fig. 1. Implementation of state-level policies in response to COVID-19, ordered by date of first social distancing policy.
Although policies implemented through April 5, 2020 are shown, only effects of policies implemented through March 23, 2020 were evaluated.
Fig. 2
Fig. 2. Impacts of state-level social distancing policies on population mobility.
a Average effect on mobility of state-wide emergency declaration orders. b Average effect on mobility of implementation of first state-wide social distancing (SD) policy in 49 states and Washington DC. Idaho is not included in this panel because its first social distancing order was enacted after March 23. c Average effect of shelter in place (SIP) order among 7 states that had issued such an order on or before March 23, 2020 and, for comparison, among the other states over a comparable time period (March 23–29 versus March 14–20, 2020). d Average change from the start of March (March 1–7, 2020) to the end of March (March 23–29, 2020). Each dot represents the estimated change in a given county (n = 2810) and each bar reflects the average change (and 95% confidence interval) across all counties.
Fig. 3
Fig. 3. Effect of the first social distancing order on time spent away from places of residence by state.
Color coding reflects the number of social distancing policies that were simultaneously enacted in each state. Boxplots indicate the 25th and 75th percentiles (box extent) and the median (center line of each box) of county-specific changes. The whiskers extend from the hinge to the largest value no further than 1.5× interquartile range from the hinge. Dots represent outliers beyond the whiskers. N = 2810 counties in 50 US states and Washington, DC.
Fig. 4
Fig. 4. Association between different combinations of first social distancing orders on average time spent away from places of residence among 2810 counties in 50 US states and Washington, DC.
Note that only two combinations of measures are observed in more than three states. Each bar reflects the average change (and 95% confidence interval) as estimated from a multivariable regression model. LGB large gathering ban, SMSC state-mandated school closures, B&RL bar and restaurant limits, NBC nonessential business closures.

Similar articles

Cited by

References

    1. Peak CM, et al. Population mobility reductions associated with travel restrictions during the Ebola epidemic in Sierra Leone: use of mobile phone data. Int. J. Epidemiol. 2018;47:1562–1570. doi: 10.1093/ije/dyy095. - DOI - PMC - PubMed
    1. Chowell G, et al. Characterizing the epidemiology of the 2009 influenza A/H1N1 pandemic in Mexico. PLoS Med. 2011;8:e1000436. doi: 10.1371/journal.pmed.1000436. - DOI - PMC - PubMed
    1. Kraemer MUG, et al. The effect of human mobility and control measures on the COVID-19 epidemic in China. Science. 2020;368:493–497. doi: 10.1126/science.abb4218. - DOI - PMC - PubMed
    1. Tian H, et al. An investigation of transmission control measures during the first 50 days of the COVID-19 epidemic in China. Science. 2020;368:638–642. doi: 10.1126/science.abb6105. - DOI - PMC - PubMed
    1. Maier BF, Brockmann D. Effective containment explains subexponential growth in recent confirmed COVID-19 cases in China. Science. 2020;368:742–746. doi: 10.1126/science.abb4557. - DOI - PMC - PubMed

Publication types