

Modulation of the immune microenvironment of high-risk ductal carcinoma in situ by intralesional pembrolizumab injection
- PMID: 34035311
- PMCID: PMC8149838
- DOI: 10.1038/s41523-021-00267-z
Modulation of the immune microenvironment of high-risk ductal carcinoma in situ by intralesional pembrolizumab injection
Abstract
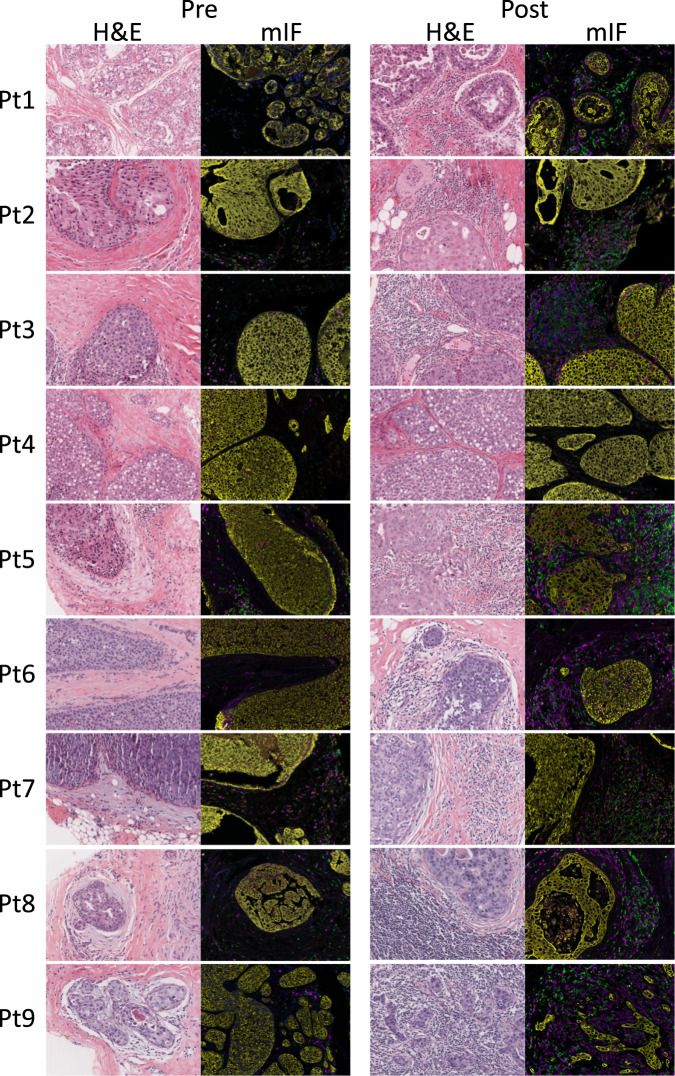
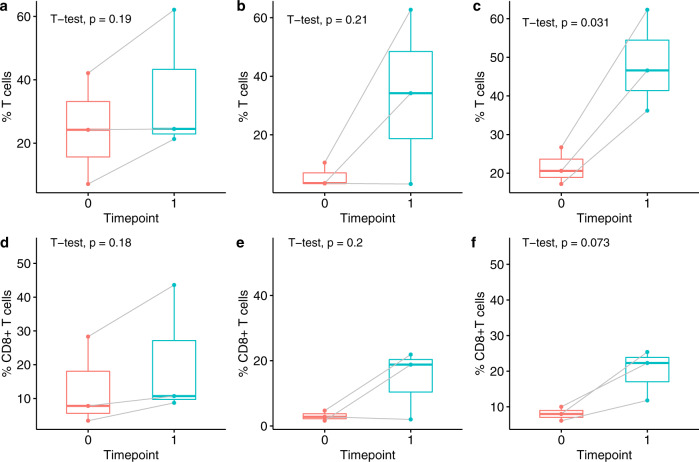
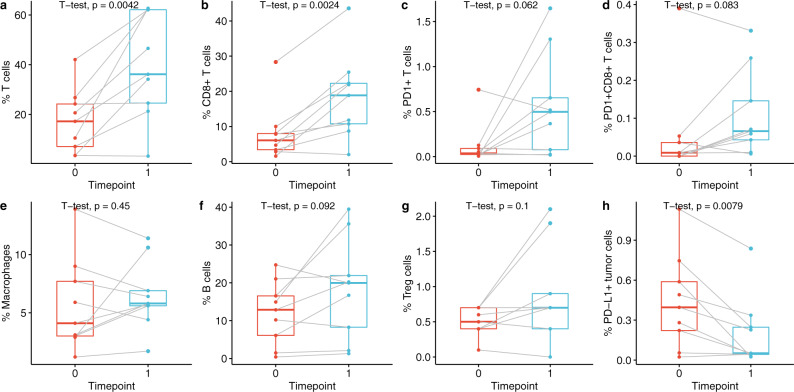
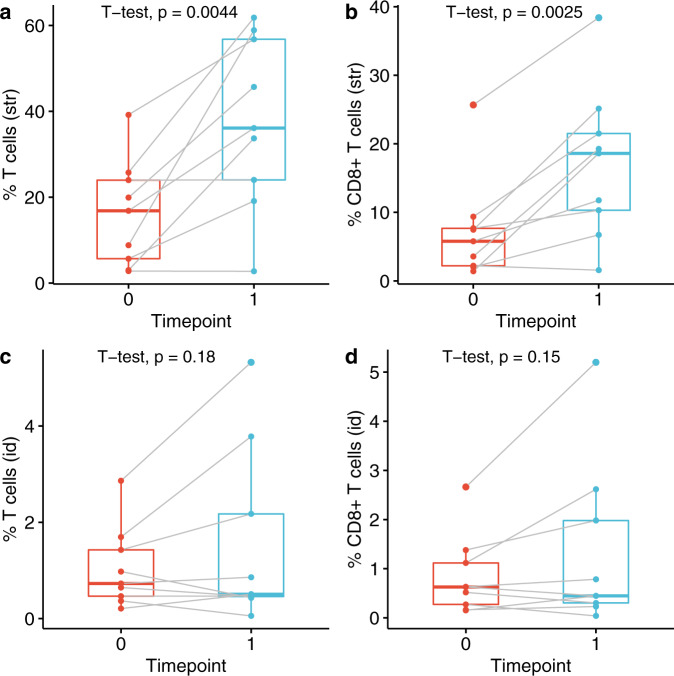
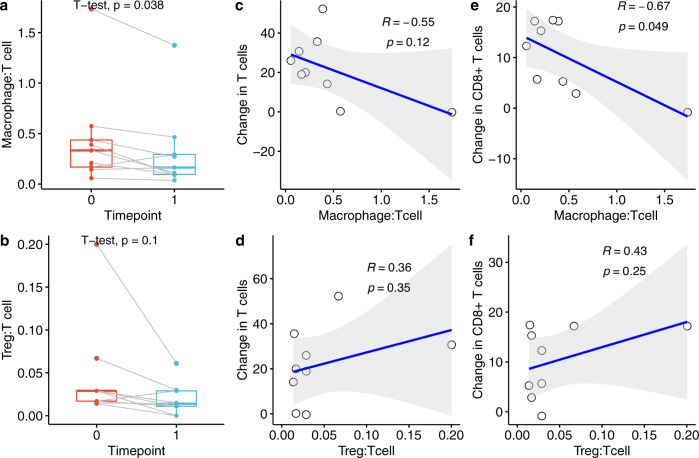
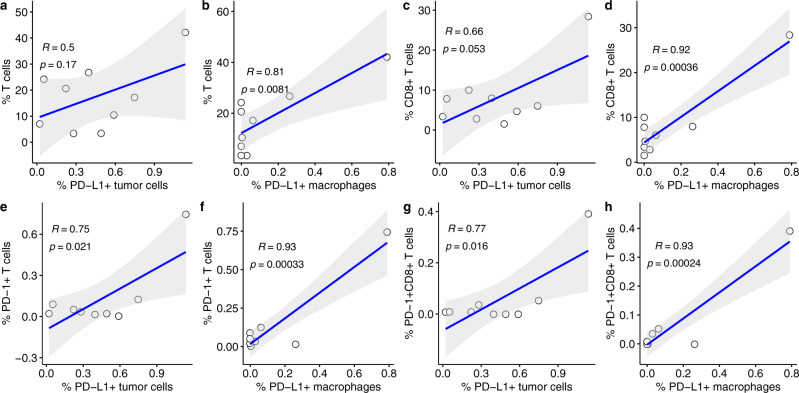
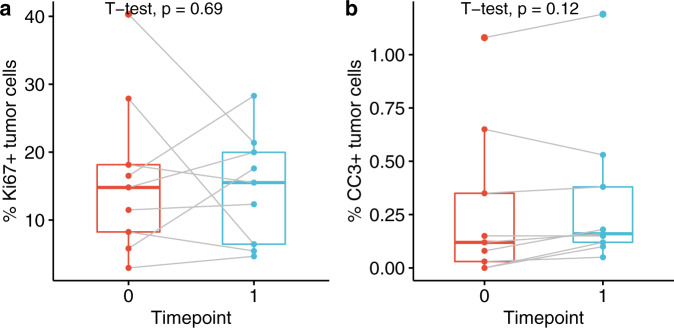
Ductal carcinoma in situ (DCIS) is a risk factor for the subsequent development of invasive breast cancer. High-risk features include age <45 years, size >5 cm, high-grade, palpable mass, hormone receptor negativity, and HER2 positivity. We have previously shown that immune infiltrates are positively associated with these high-risk features, suggesting that manipulating the immune microenvironment in high-risk DCIS could potentially alter disease progression. Patients with high-risk DCIS were enrolled in this 3 × 3 phase 1 dose-escalation pilot study of 2, 4, and 8 mg intralesional injections of the PD-1 immune checkpoint inhibitor, pembrolizumab. Study participants received two intralesional injections, three weeks apart, prior to surgery. Tissue from pre-treatment biopsies and post-treatment surgical resections was analyzed using multiplex immunofluorescence (mIF) staining for various immune cell populations. The intralesional injections were easily administered and well-tolerated. mIF analyses demonstrated significant increases in total T cell and CD8+ T cell percentages in most patients after receiving pembrolizumab, even at the 2 mg dose. T cell expansion was confined primarily to the stroma rather than within DCIS-containing ducts. Neither cleaved caspase 3 (CC3) staining, a marker for apoptosis, nor DCIS volume (as measured by MRI) changed significantly following treatment. Intralesional injection of pembrolizumab is safe and feasible in patients with DCIS. Nearly all patients experienced robust total and CD8+ T cell responses. However, we did not observe evidence of cell death or tumor volume decrease by MRI, suggesting that additional strategies may be needed to elicit stronger anti-tumor immunity.
Conflict of interest statement
The authors declare no competing interests.
Figures
Similar articles
-
Tumor microenvironmental determinants of high-risk DCIS progression.Res Sq [Preprint]. 2024 May 9:rs.3.rs-4126092. doi: 10.21203/rs.3.rs-4126092/v1. Res Sq. 2024. PMID: 38766192 Free PMC article. Preprint.
-
Comprehensive multiplexed immune profiling of the ductal carcinoma in situ immune microenvironment regarding subsequent ipsilateral invasive breast cancer risk.Br J Cancer. 2022 Oct;127(7):1201-1213. doi: 10.1038/s41416-022-01888-2. Epub 2022 Jun 29. Br J Cancer. 2022. PMID: 35768550 Free PMC article.
-
Immune microenvironment in ductal carcinoma in situ: a comparison with invasive carcinoma of the breast.Breast Cancer Res. 2020 Mar 26;22(1):32. doi: 10.1186/s13058-020-01267-w. Breast Cancer Res. 2020. PMID: 32216826 Free PMC article.
-
Ductal Carcinoma In Situ - Quo Vadis?Chirurgia (Bucur). 2021 Dec;116(5 Suppl):S5-S6. Chirurgia (Bucur). 2021. PMID: 34967322 Review.
-
Prognostic role of immune infiltrates in breast ductal carcinoma in situ.Breast Cancer Res Treat. 2019 Aug;177(1):17-27. doi: 10.1007/s10549-019-05272-2. Epub 2019 May 27. Breast Cancer Res Treat. 2019. PMID: 31134489 Review.
Cited by
-
Distribution characteristics and prognostic value of TIM-1 in patients with lung adenocarcinoma.Front Immunol. 2025 May 30;16:1602868. doi: 10.3389/fimmu.2025.1602868. eCollection 2025. Front Immunol. 2025. PMID: 40519901 Free PMC article.
-
Breaking new ground in ductal carcinoma in situ management: the promise of intratumoral messenger ribonucleic acid-2752 and pembrolizumab.Ann Transl Med. 2025 Jun 27;13(3):25. doi: 10.21037/atm-25-49. Epub 2025 Jun 24. Ann Transl Med. 2025. PMID: 40689070 Free PMC article. No abstract available.
-
Tumor microenvironmental determinants of high-risk DCIS progression.Res Sq [Preprint]. 2024 May 9:rs.3.rs-4126092. doi: 10.21203/rs.3.rs-4126092/v1. Res Sq. 2024. PMID: 38766192 Free PMC article. Preprint.
-
Large and diffuse ductal carcinoma in situ: potentially lethal subtypes of "preinvasive" disease.Int J Clin Oncol. 2022 Jan;27(1):121-130. doi: 10.1007/s10147-021-02036-1. Epub 2021 Oct 7. Int J Clin Oncol. 2022. PMID: 34618239 Free PMC article.
-
Intratumoral Injection of mRNA-2752 and Pembrolizumab for High-Risk Ductal Carcinoma In Situ: A Phase 1 Nonrandomized Clinical Trial.JAMA Oncol. 2025 Mar 1;11(3):288-292. doi: 10.1001/jamaoncol.2024.5927. JAMA Oncol. 2025. PMID: 39821301 Clinical Trial.
References
Grants and funding
LinkOut - more resources
Full Text Sources
Other Literature Sources
Research Materials
Miscellaneous
