

COVID-19 infection data encode a dynamic reproduction number in response to policy decisions with secondary wave implications
- PMID: 34035322
- PMCID: PMC8149655
- DOI: 10.1038/s41598-021-90227-1
COVID-19 infection data encode a dynamic reproduction number in response to policy decisions with secondary wave implications
Abstract
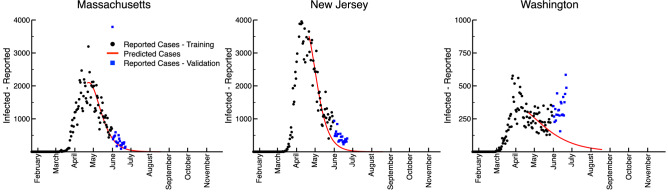
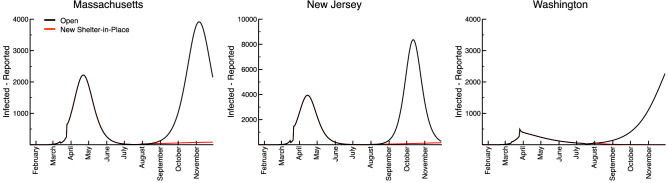
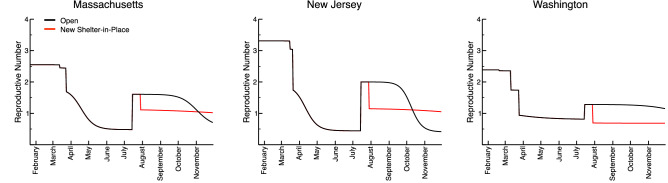
The SARS-CoV-2 virus is responsible for the novel coronavirus disease 2019 (COVID-19), which has spread to populations throughout the continental United States. Most state and local governments have adopted some level of "social distancing" policy, but infections have continued to spread despite these efforts. Absent a vaccine, authorities have few other tools by which to mitigate further spread of the virus. This begs the question of how effective social policy really is at reducing new infections that, left alone, could potentially overwhelm the existing hospitalization capacity of many states. We developed a mathematical model that captures correlations between some state-level "social distancing" policies and infection kinetics for all U.S. states, and use it to illustrate the link between social policy decisions, disease dynamics, and an effective reproduction number that changes over time, for case studies of Massachusetts, New Jersey, and Washington states. In general, our findings indicate that the potential for second waves of infection, which result after reopening states without an increase to immunity, can be mitigated by a return of social distancing policies as soon as possible after the waves are detected.
Conflict of interest statement
The authors declare no competing interests.
Figures
Similar articles
-
State variation in effects of state social distancing policies on COVID-19 cases.BMC Public Health. 2021 Jun 28;21(1):1239. doi: 10.1186/s12889-021-11236-3. BMC Public Health. 2021. PMID: 34182972 Free PMC article.
-
Public Compliance With Social Distancing Measures and SARS-CoV-2 Spread : A Quantitative Analysis of 5 States.Public Health Rep. 2021 Jul-Aug;136(4):475-482. doi: 10.1177/00333549211011254. Epub 2021 Apr 28. Public Health Rep. 2021. PMID: 33909541 Free PMC article.
-
Chance elections, social distancing restrictions, and KENTUCKY's early COVID-19 experience.PLoS One. 2021 Jul 1;16(7):e0250152. doi: 10.1371/journal.pone.0250152. eCollection 2021. PLoS One. 2021. PMID: 34197461 Free PMC article.
-
Social distancing policies in 22 African countries during the COVID-19 pandemic: a desk review.Pan Afr Med J. 2020 Dec 14;37(Suppl 1):46. doi: 10.11604/pamj.supp.2020.37.46.27026. eCollection 2020. Pan Afr Med J. 2020. PMID: 33552374 Free PMC article. Review.
-
Alignment and authority: Federalism, social policy, and COVID-19 response.Health Policy. 2023 Jan;127:12-18. doi: 10.1016/j.healthpol.2022.11.007. Epub 2022 Nov 19. Health Policy. 2023. PMID: 36435630 Free PMC article. Review. No abstract available.
Cited by
-
A weapon to fight against pervasive Omicron: systematic actions transiting to pre-COVID normal.Front Public Health. 2023 Sep 5;11:1204275. doi: 10.3389/fpubh.2023.1204275. eCollection 2023. Front Public Health. 2023. PMID: 37744521 Free PMC article.
-
An evaluation of prospective COVID-19 modelling studies in the USA: from data to science translation.Lancet Digit Health. 2022 Oct;4(10):e738-e747. doi: 10.1016/S2589-7500(22)00148-0. Lancet Digit Health. 2022. PMID: 36150782 Free PMC article. Review.
References
-
- Patel A, Jernigan DB. 2019-nCoV CDC Response Team, Initial public health response and interim clinical guidance for the 2019 novel coronavirus outbreak—United States, December 31, 2019-February 4, 2020 (Reprinted from Recomm Rep, vol 68, 2019) Am. J. Transplant. 2020;20:889–895. doi: 10.1111/ajt.15805. - DOI - PMC - PubMed
-
- IHME COVID-19 Health Service Utilization Forecasting Team. Murray CJL. Forecasting COVID-19 impact on hospital bed-days, ICU-days, ventilator-days, and deaths by US State in the next 4 months. MedRxiv. 2020 doi: 10.1101/2020.03.27.20043752. - DOI
-
- U.S. Army Corps of Engineers, Alternate Care Sites (ACS) (2020). https://www.usace.army.mil/coronavirus/alternate-care-sites/ (Accessed 14 July 2020).
MeSH terms
LinkOut - more resources
Full Text Sources
Other Literature Sources
Medical
Miscellaneous
