

Variable coastal hypoxia exposure and drivers across the southern California Current
- PMID: 34035327
- PMCID: PMC8149850
- DOI: 10.1038/s41598-021-89928-4
Variable coastal hypoxia exposure and drivers across the southern California Current
Abstract
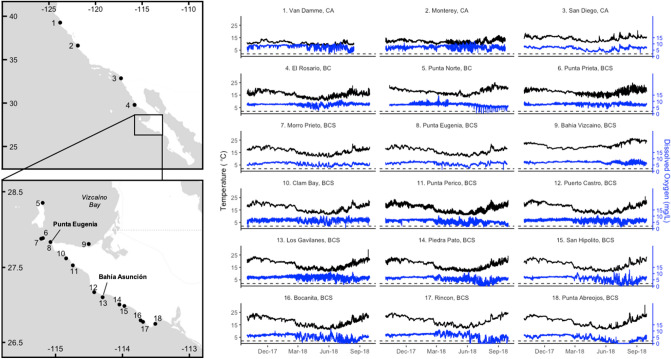
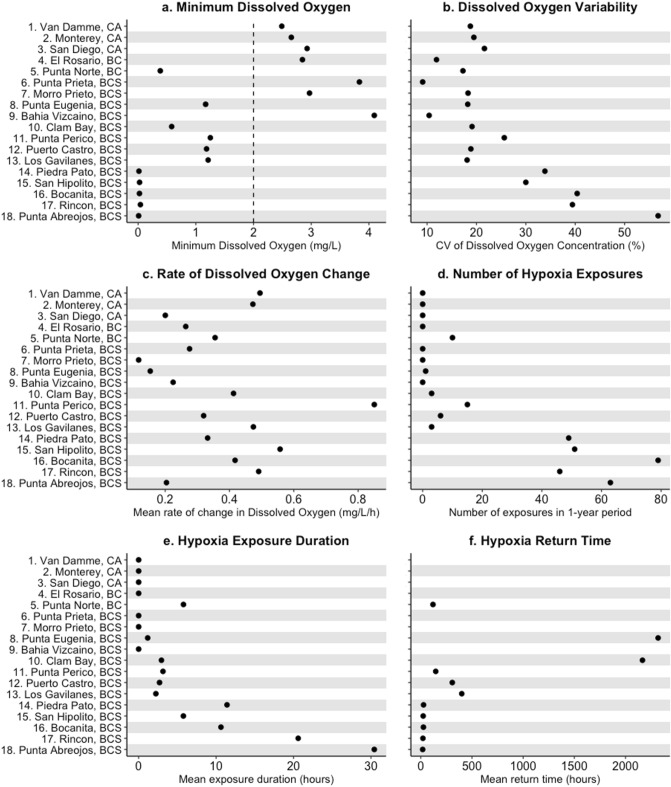
Declining oxygen is one of the most drastic changes in the ocean, and this trend is expected to worsen under future climate change scenarios. Spatial variability in dissolved oxygen dynamics and hypoxia exposures can drive differences in vulnerabilities of coastal ecosystems and resources, but documentation of variability at regional scales is rare in open-coast systems. Using a regional collaborative network of dissolved oxygen and temperature sensors maintained by scientists and fishing cooperatives from California, USA, and Baja California, Mexico, we characterize spatial and temporal variability in dissolved oxygen and seawater temperature dynamics in kelp forest ecosystems across 13° of latitude in the productive California Current upwelling system. We find distinct latitudinal patterns of hypoxia exposure and evidence for upwelling and respiration as regional drivers of oxygen dynamics, as well as more localized effects. This regional and small-scale spatial variability in dissolved oxygen dynamics supports the use of adaptive management at local scales, and highlights the value of collaborative, large-scale coastal monitoring networks for informing effective adaptation strategies for coastal communities and fisheries in a changing climate.
Conflict of interest statement
The authors declare no competing interests.
Figures


References
-
- Laffoley D, Baxter JM, editors. Ocean deoxygenation: Everyone’s problem. Causes, impacts, consequences and solutions. IUCN, International Union for Conservation of Nature; 2019.
-
- Booth JAT, Woodson CB, Sutula M, Micheli F, Weisberg SB, Bograd SJ, Steele A, Schoen J, Crowder LB, Nin E. Patterns and potential drivers of declining oxygen content along the southern California coast. Limnol. Oceanogr. 2014;59:1127–1138. doi: 10.4319/lo.2014.59.4.1127. - DOI
-
- Gilbert D, Rabalais NN, Díaz RJ, Zhang J. Evidence for greater oxygen decline rates in the coastal ocean than in the open ocean. Biogeosciences. 2010;7:2283–2296. doi: 10.5194/bg-7-2283-2010. - DOI
Publication types
LinkOut - more resources
Full Text Sources
Other Literature Sources
