. 2021 May 25;11(1):10900.
doi: 10.1038/s41598-021-90231-5.

A predictive model for vertebrate bone identification from collagen using proteomic mass spectrometry

Affiliations

A predictive model for vertebrate bone identification from collagen using proteomic mass spectrometry

Heyi Yang et al. Sci Rep. .

Abstract

Proteogenomics is an increasingly common method for species identification as it allows for rapid and inexpensive interrogation of an unknown organism's proteome-even when the proteome is partially degraded. The proteomic method typically uses tandem mass spectrometry to survey all peptides detectable in a sample that frequently contains hundreds or thousands of proteins. Species identification is based on detection of a small numbers of species-specific peptides. Genetic analysis of proteins by mass spectrometry, however, is a developing field, and the bone proteome, typically consisting of only two proteins, pushes the limits of this technology. Nearly 20% of highly confident spectra from modern human bone samples identify non-human species when searched against a vertebrate database-as would be necessary with a fragment of unknown bone. These non-human peptides are often the result of current limitations in mass spectrometry or algorithm interpretation errors. Consequently, it is difficult to know if a "species-specific" peptide used to identify a sample is actually present in that sample. Here we evaluate the causes of peptide sequence errors and propose an unbiased, probabilistic approach to determine the likelihood that a species is correctly identified from bone without relying on species-specific peptides.


Conflict of interest statement

The authors declare no competing interests.

Figures
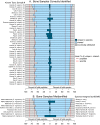
Figure 1
Figure 1
Proportion of peptides and spectra correctly and incorrectly attributed to sample species. Rows represent MS/MS data from each sample searched against an NR vertebrate database. (A) Sample species correctly identified. (B) Samples of known species misidentified due to poor database representation (Supplemental Table S5). Species assigned by MS/MS are listed on the right. Total number of peptides and spectra found for each sample can be found in Supplemental Table S9A.
Figure 2
Figure 2
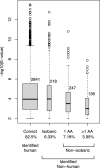
E-values of peptides identified by MS/MS in 19 human bone samples searched against a vertebrate database. Boxplots show distributions of E-values of spectra that matched to human peptides (correctly identified) (left) and spectra that matched only to non-human peptide sequences (incorrectly attributed). Width of boxes correspond to the number of spectra in each category, also printed above each box. Incorrectly attributed peptides differ from human consensus sequence peptides by one or more amino acids. These amino acid differences can be isobaric or non-isobaric. A post hoc Tukey test revealed correct peptides and isobaric peptides to be statistically similar and 1 AA and > 1 AA peptides also to be to be statistically similar. All other comparisons were significantly different (p < 0.01).
Figure 3
Figure 3
Comparison of peptide, PMS and spectra methods for determining species. (A) Comparison of distribution of ratios for correctly and incorrectly identified bone samples of known species, results from a mammal database search. (a) Non-redundant peptide/total peptides, (b) peptide-spectrum matches (PSM)—i.e. all (redundant) peptide identifications/total peptides, (c) all (redundant) spectra/total spectra. On average 77% of spectra were found two or more times with a mean of ~ 5.7 spectra for each sequence (median 3, range 6–55). As results are from a mammal database search, incorrectly identified samples include all seven non-mammal samples. Above each box plot is the total number of samples in each category. (B) Comparison of distribution of ratios (peptides or spectra assigned to human/total peptides or total spectra identified) for human and non-human bone samples using results from vertebrate database search. Descriptions of a–c same as (A). Rhesus macaque, the only non-human primate, is circled in red.
Figure 4
Figure 4
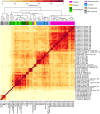
Heatmap and hierarchical clustering of pairwise comparison of bone sample spectra. Symmetric heat map of similarity ratios between all bones. Darker red indicates greater similarities between samples, light yellow indicates samples with a few or no spectra in common. Importantly, sample clustering coincides, for the most part, with evolutionarily similar taxa as seen in the dendrogram and taxa color-coded bar at top of figure. On the right axis the total number of spectra for each sample is listed along with common and Latin names of species, or most specific known taxa, indicated by * (see “Methods” for details).
Figure 5
Figure 5
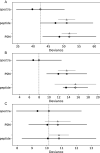
Comparison of peptide, PSM, and spectra models using PSIS-LOO. PSIS-LOO estimates comparing pointwise out-of-sample prediction accuracy demonstrate that the spectra method outperforms the PSM and peptide methods for species (A), order (B) and human identification (C). Solid circles are the in-sample deviance of each model, open circles are the PSIS-LOO estimate, and the solid dark line that passes through the open circle is the standard error of the estimate. The grey triangle and grey lines show the standard error of the difference between each PSIS-LOO and the top-ranked PSIS-LOO.
Figure 6
Figure 6
Receiver operating characteristic (ROC) curve of posterior probability of correct species assignment using spectra ratio from leave-one-out cross validation. Full leave-one-out cross validation with spectra data was performed and a ROC curve generated using the mean of the posterior predictive distribution for each unseen sample, and the area under the curve (AUC) calculated. For the prediction of whether the top hit species (by spectra ratio) was correct, the AUC was 0.825.
Figure 7
Figure 7
Predictive posterior distributions for species, order, and human origin of samples from exact leave-one-out cross validation. (A) Predictive posterior distributions of correct species assignment using spectra ratios from a mammalian database search. Wider, flatter distributions reflect greater uncertainty in the model for these values. Mammal bones for which species was incorrectly identified by spectra ratio are: 1, 2, 4, and 8 = Virginia white-tailed deer, 3 = brown bear, 5 = woodchuck, 6 = Northern river otter, 7 = grey squirrel, and 9 = Virginia opossum, all of which are species poorly represented in the database (See Supplemental Table S5). 10–16 are the seven non-mammals (see Supplemental Table S9). (B) Predictive posterior distributions of correct order assignment using spectra ratios from a mammalian database search. The seven non-mammalian samples were incorrectly identified by mammalian database search all have very low predicted probability of correct order assignment (bottom left, in orange). The orders of all mammals are correctly identified by spectra ratio except Virginia opossum (order Didelphimorphia), which was identified as order Dasyuromorphia. (C) Predictive posterior distributions of human origin using human spectra ratios from a vertebrate database search. Correctly identified human samples have narrow distributions with high predicted probability of human origin, and are clearly separated from non-human samples with very low probabilities. The only exception and the only non-human primate in the dataset, rhesus monkey, stretches from the bottom right (orange) to center of the figure.
Figure 8
Figure 8
Models of correct species, order and human identifications. Logistic regression models shown in (AC) are generated using all available sample data in order to illustrate posterior probability distributions for a range of possible spectra ratios. (A) Logistic regression model for probability of correct species identification using spectra ratio, trained on mammalian bone samples of known species and all non-mammal bone samples using a mammalian database. Ratios of correctly identified samples are at y = 1, misidentified samples at y = 0. Mean probability of correct species identification at all possible spectra ratios (0–1) is shown within a 95% confidence interval. (B) Logistic regression model for probability of correct order identification using spectra ratio, trained on mammalian bone samples of known order and all non-mammal bone samples using a non-mammalian database. Ratios of correctly identified samples are at y = 1, misidentified samples at y = 0. Mean probability of correct order identification at all possible spectra ratios (0–1) is shown within a 95% confidence interval. (C) Logistic regression model for probability of human identification using spectra ratio, trained on known human and non-human bones samples searched against a vertebrate database and ratios of human assigned spectra to total spectra determined. Ratios of human samples are at y = 1, non-human samples at y = 0. Mean probability of human identification at all possible human spectra ratios (0–1) is shown within a 95% confidence interval. The one non-human primate tested (rhesus monkey, Macaca mulatta) had a human spectra ratio of 0.68, showing clear separation of Macaca from human samples (circled red).

References

    1. Jarman KH, et al. Proteomics goes to court: A statistical foundation for forensic toxin/organism identification using bottom-up proteomics. J. Proteome Res. 2018;17:3075–3085. doi: 10.1021/acs.jproteome.8b00212. - DOI - PubMed
    1. Kirby DP, Buckley M, Promise E, Trauger SA, Holdcraft TR. Identification of collagen-based materials in cultural heritage. Analyst. 2013;138:4849–4858. doi: 10.1039/c3an00925d. - DOI - PubMed
    1. Gu M, Buckley M. Semi-supervised machine learning for automated species identification by collagen peptide mass fingerprinting. BMC Bioinform. 2018;19:241. doi: 10.1186/s12859-018-2221-3. - DOI - PMC - PubMed
    1. Schroeter ER, DeHart CJ, Schweitzer MH, Thomas PM, Kelleher NL. Bone protein “extractomics”: Comparing the efficiency of bone protein extractions of Gallusgallus in tandem mass spectrometry, with an eye towards paleoproteomics. PeerJ. 2016;4:e2603. doi: 10.7717/peerj.2603. - DOI - PMC - PubMed
    1. Stover DA, Verrelli BC. Comparative vertebrate evolutionary analyses of type I collagen: Potential of COL1a1 gene structure and intron variation for common bone-related diseases. Mol. Biol. Evol. 2011;28:533–542. doi: 10.1093/molbev/msq221. - DOI - PubMed

Publication types

LinkOut - more resources