Comparative Study
. 2021 May 25;11(1):10933.
doi: 10.1038/s41598-021-90161-2.

Kinship of conditionally immortalized cells derived from fetal bone to human bone-derived mesenchymal stroma cells

Affiliations
Comparative Study

Kinship of conditionally immortalized cells derived from fetal bone to human bone-derived mesenchymal stroma cells

S Marozin et al. Sci Rep. .

Abstract

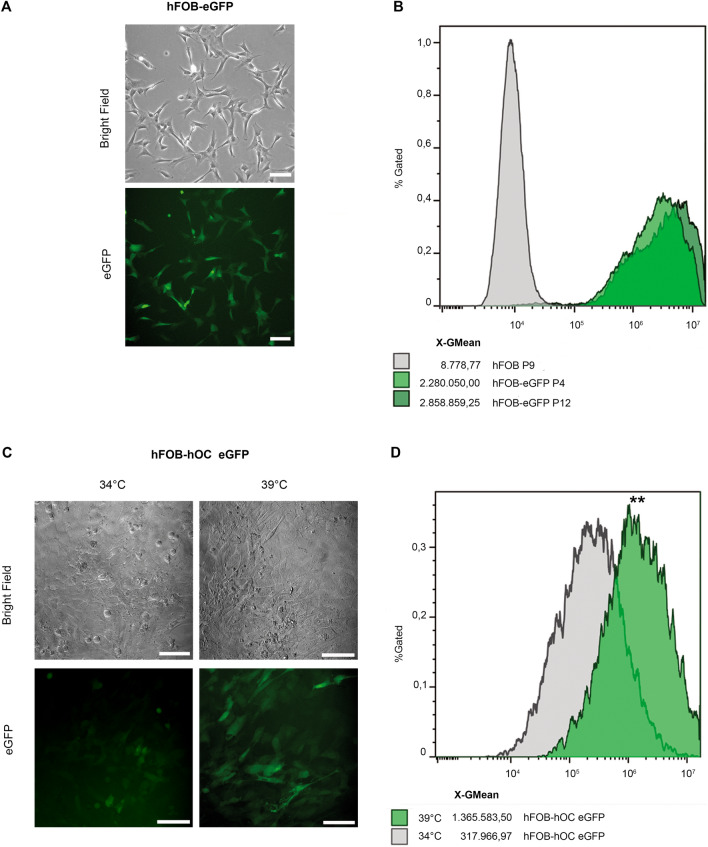
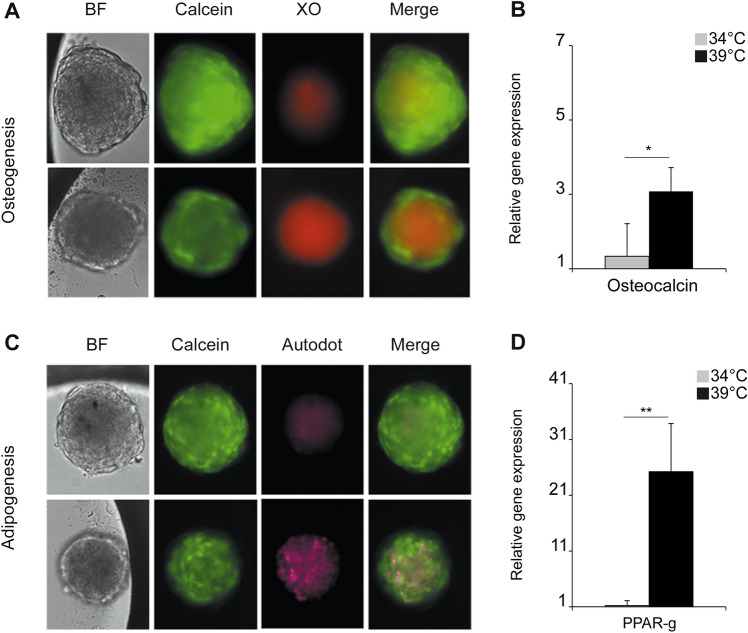
The human fetal osteoblast cell line (hFOB 1.19) has been proposed as an accessible experimental model for study of osteoblast biology relating to drug development and biomaterial engineering. For their multilineage differentiation potential, hFOB has been compared to human mesenchymal progenitor cells and used to investigate bone-metabolism in vitro. Hereby, we studied whether and to what extent the conditionally immortalized cell line hFOB 1.19 can serve as a surrogate model for bone-marrow derived mesenchymal stromal cells (bmMSC). hFOB indeed exhibit specific characteristics reminiscent of bmMSC, as colony formation, migration capacity and the propensity to grow as multicellular aggregates. After prolonged culture, in contrast to the expected effect of immortalization, hFOB acquired a delayed growth rate. In close resemblance to bmMSC at increasing passages, also hFOB showed morphological abnormalities, enlargement and finally reduced proliferation rates together with enhanced expression of the cell cycle inhibitors p21 and p16. hFOB not only have the ability to undergo multilineage differentiation but portray several important aspects of human bone marrow mesenchymal stromal cells. Superior to primary MSC and osteoblasts, hFOB enabled the generation of continuous cell lines. These provide an advanced basis for investigating age-related dysfunctions of MSCs in an in vitro 3D-stem cell microenvironment.


Conflict of interest statement

The authors declare no competing interests.

Figures

Figure 1
Figure 1
Characterization of hFOB1.19 cells. (A) Differentiation capacity towards the osteogenic lineage was tested after cell seeding at a density of 1 × 105 cells/cm2 in DMEM:F12 medium at 34 °C and 5% CO2/20% O2. (a) The following day osteogenic differentiation was induced by shifting the temperature to 39 °C. After 24 days, cells were stained with Alizarin Red S. (b) As a control, cells were cultivated at 34 °C for 24 days and also stained with Alizarin Red. (c) Corresponding qPCR of the osteogenic marker (Osteocalcin) was normalized to YWHAZ (Tyrosine 3-monooxygenase) gene. (d) In order to examine adipogenic differentiation capacity, cells were seeded at a density of 1.5 × 105 cells/cm2 in DMEM:F12 medium at 34 °C and 5% CO2/20% O2. Adipogenic differentiation was induced by shifting the temperature to 39 °C and supplementing the medium with the differentiation mix (0.5 mM isobutyl-methylxanthine, 1 µM dexamethasone, 10 µM insulin, 60 µM indomethacin) for 16 days. (e) Adipogenic control cells were incubated in DMEM:F12 medium at 34 °C and 5% CO2/20% O2 for 16 days. (f) Expression levels of the adipogenic marker (PPARg) was assessed by qPCR. For normalization YWHAZ (Tyrosine 3-monooxygenase) was used as a reference gene. (B) Cultures of hFOBs at 34 °C, 20% O2 were subjected to surface antigen analysis by flow cytometry. Flow cytometry was performed using Cytoflex S and the analysis performed with Kaluza software (Beckman-Coulter). Surface antigen in green and isotype control in grey.
Figure 2
Figure 2
Transgenic hFOB reporter cell lines. (A) hFOB cells were transduced with a recombinant lentivirus vector bearing the reporter construct UbC-eGFP resulting in the cell line hFOB-eGFP. Constitutively active expression of eGFP was visualized by fluorescence microscopy. Bars indicate 100 µm. (B) Stable eGFP expression over cell passaging was assessed by flow-cytometry comparing wild-type hFOB (in grey) with hFOB-eGFP (in green) at low (P4) and high cell passage (P12). Data acquisition and analysis were performed by means of Cytoflex S, software CytExpert and Kaluza. (C) An inducible cell line expressing eGFP under the control of the full length promoter for the human osteocalcin (hFOB-hOC eGFP) was transduced and differentiation was induced by incubation at 39 °C for 3 days. Images of cells incubated at 34 °C (undifferentiated control) versus induced cultures at 39 °C were taken to monitor eGFP expression. (D) Representative histograms of flow-cytometric analysis of reporter gene expression in hFOB-hOC eGFP activated at 39 °C (green) for 3 days. Uninduced cells cultured at 34 °C (in grey) displayed a basal expression of eGFP. Geometric mean of fluorescence intensity is indicated. Statistical significance of reporter activity at 39 °C of three independent experiments was calculated using an unpaired Student t test.
Figure 3
Figure 3
Scaffold-free spheroids. (A) hFOB expressing eGFP (hFOB-eGFP) were allowed to settle in low attachment 96-well U-bottom plates. After aggregation, spheroids were grown for 6 days. Living-cell staining with Hoechst was performed together with image acquisition at day 2 and 6 post-seeding. (B) hFOB-eGFP cells, at the density of 106 cells/well, were allowed to form spheroids in static suspension in a low attachment Petri dish in the absence of serum. Serum was replaced by 15% Knockout Serum Replacement (KSR) during the entire experiment. Representative images of spheroids growing for 6 days at 34 °C 20% O2 (DMiL Leica). Scale bars indicate 100 µm. (C) The diameters of the spheroids were assessed using LAS X software (Leica). *P = 0.04. (D) Cell outgrowth from hFOB-eGFP spheroids obtained in KSR medium was examined one day after spheroid formation. Aggregates were transferred to complete growth medium at 34 °C 20% O2 in a 24-well cell culture grade plastic plate. Outgrowth of cells from spheroids was observed 3 days after transfer (DmiL, Leica, LAS X software).
Figure 4
Figure 4
Differentiation of hFOB spheroids. (A) Spheroids were obtained using low attachment plates. 1000 cells were seeded per well and allowed to aggregate at the bottom of the plates for 48 h at 34 °C. Thereafter, plates were incubated for 3 days at 34 °C (upper panel) or at 39 °C (lower panel). Spheroids were stained with Calcein-AM (Calcein) and calcium deposition was visualized with Xylenol Orange (XO). For adipogenic differentiation (C) spheroids were incubated in adipogenic medium at 34 °C (upper panel) or 39 °C (lower panel) for 3 days. Cells were live-stained with Calcein and Autodot (pink). Images were taken using a DMi8 microscope (Leica) and acquisition analysis was performed with LAS X Software. (B, D) Quantitative PCR for the genes osteocalcin and PPARγ was performed to confirm osteogenic or adipogenic differentiation at day 4 post induction. Relative expression was normalized to hFOB cells grown in 2D at 34 °C.
Figure 5
Figure 5
Effects of temperature and oxygen tension on hFOB properties. (A) hFOB cells were seeded at a density of 10 cells/cm2 and allowed to form colonies for 15 days at 34 °C/20% O2 (34–20); 34 °C/3% O2 (34–3); 37 °C/20% O2 (37–20) and 37 °C/3% O2 (37–3). After fixation and staining with crystal violet, colonies were counted and depicted as mean ± standard deviation (n = 3). B) hFOBs were seeded at a density of 2 × 102/cm2 in each well of an impedance reader E-plate and cell growth was non-invasively monitored every 2 h over a time lapse of 8 days. Impedance was expressed as a Cell Index (CI) value. Representative graph from xCELLigence system are shown for growth curves of hFOB cultured at specified temperature and oxygen conditions. (C) CI-values were compared at 6 days after seeding. (D) Cell wounding and assessment of migratory behavior of hFOB at passages 5–7 at various culture conditions. Quantitative image data acquisition was performed with Live Cell Imager CELL IQ and analysis was performed with CellActivision Software (Yokogama). Results for quantitative analysis of percentage of gap closure at the different culture conditions are shown for 3 h and 6 h after gap opening. (E) Representative images at given conditions are shown. Gap closures are highlighted at 0 h, 3 h and 6 h after gap opening with pink lines.
Figure 6
Figure 6
Effects of long-term culture on hFOB stemness and migratory behavior. (A) Brightfield microscopy (magnification × 200, scale bar 100 µm) of hFOB cells passage 7 and 20. (B) CFU-F of hFOB cells of passages 5–7, 10–12 and 18–20 were performed in triplicates at the given environmental settings. Cells were seeded at a density of 10 cells/cm2 (600 cells/plate) and incubated for 15 days. Cells were stained with Crystal violet. Mean number ± standard deviation (SD) of resulting colony-forming units fibroblasts (CFU-F) was determined. (C) Colony formation (2nd round) using cells derived from a previously formed colony (1st round) was performed in triplicate at the given temperature and oxygen tension. Cells were seeded at a density of 10 cells/cm2 (600 cells/plate) and incubated for 15 days. After the 1st round, cells were trypsinized and seeded again for a 2nd term of colony formation (density of 10 cells/cm2). (D) mRNA levels within hFOB cells at passage 10–12 or passage 18–20 encoding CDKN2A (p16) and CDKN1A (p21) were measured by RT-qPCR, normalized to YWHAZ and plotted as fold induction relative to the levels of hFOB P5-7. (E) Migratory behavior of passage 5–7 and passage 18–20 cells at 34 °C 20% O2. Determination of %-gap closure after 3 h, 6 h and 10 h. (F) Migration of hFOB passage 18–20 in the presence of IL-6 (10 ng/ml) and without IL-6 (CTR). Determination of %-gap closure after 3 h, 6 h and 10 h. (G) Representative images of the gap closure quantified in (F) after 0, 3, 6 and 10 h post IL-6 treatment.

Similar articles

Cited by

References

    1. Caplan AI. Mesenchymal stem cells. J. Orthop. Res. 1991;9:641–650. doi: 10.1002/jor.1100090504. - DOI - PubMed
    1. Viswanathan S, et al. Mesenchymal stem versus stromal cells: International Society for Cell and Gene Therapy (ISCT(R)) Mesenchymal Stromal Cell committee position statement on nomenclature. Cytotherapy. 2019;21:1019–1024. doi: 10.1016/j.jcyt.2019.08.002. - DOI - PubMed
    1. Gnani D, et al. An early-senescence state in aged mesenchymal stromal cells contributes to hematopoietic stem and progenitor cell clonogenic impairment through the activation of a pro-inflammatory program. Aging Cell. 2019;18:e12933. doi: 10.1111/acel.12933. - DOI - PMC - PubMed
    1. Czekanska EM, Stoddart MJ, Richards RG, Hayes JS. In search of an osteoblast cell model for in vitro research. Eur. Cell Mater. 2012;24:1–17. doi: 10.22203/eCM.v024a01. - DOI - PubMed
    1. Kartsogiannis V, Ng KW. Cell lines and primary cell cultures in the study of bone cell biology. Mol. Cell Endocrinol. 2004;228:79–102. doi: 10.1016/j.mce.2003.06.002. - DOI - PubMed

Publication types

MeSH terms

Substances