. 2021 May 25;11(1):10942.
doi: 10.1038/s41598-021-90555-2.

Observing deep radiomics for the classification of glioma grades

Affiliations

Observing deep radiomics for the classification of glioma grades

Kazuma Kobayashi et al. Sci Rep. .

Abstract

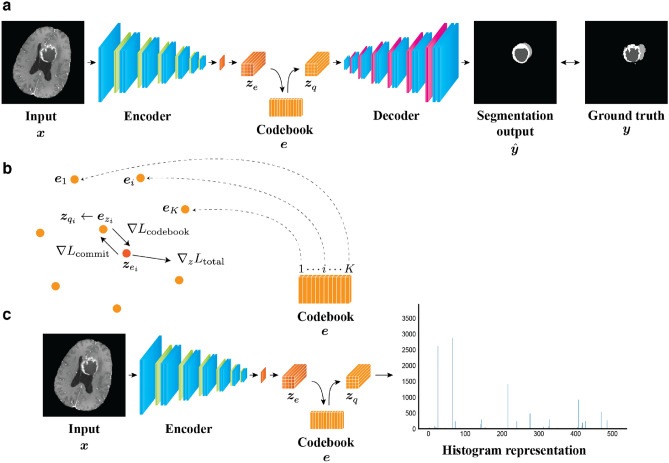
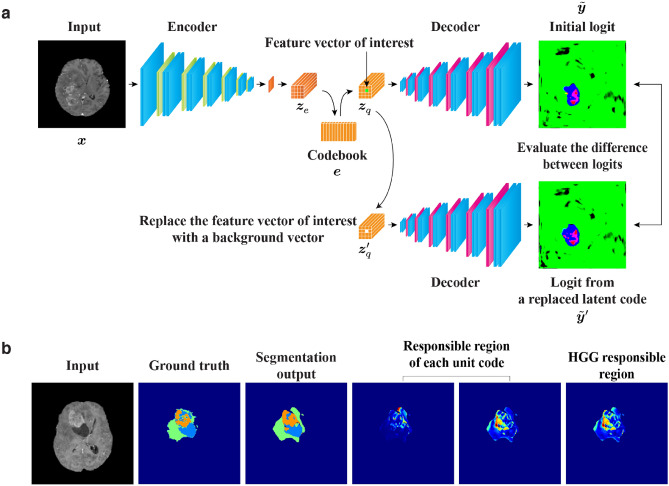
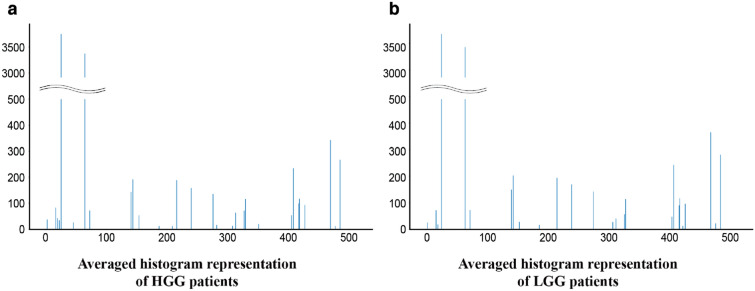
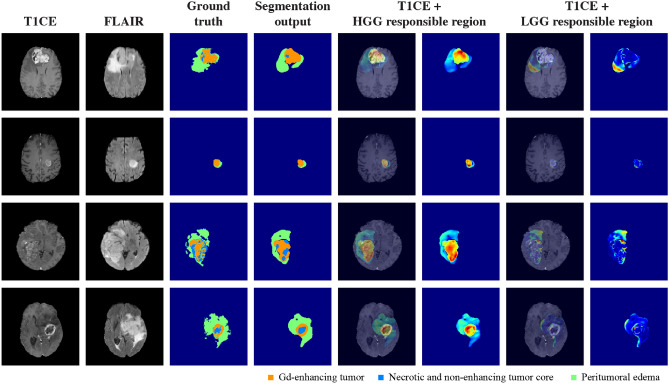
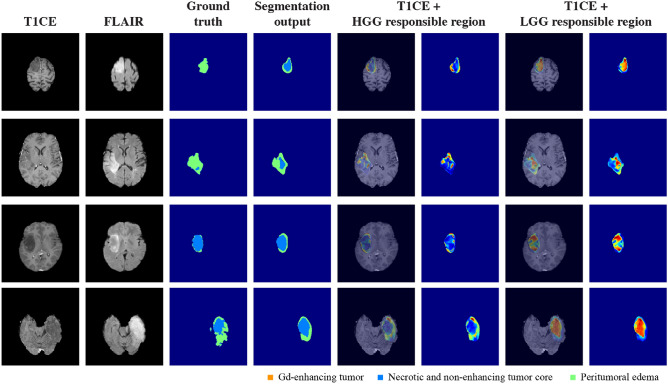
Deep learning is a promising method for medical image analysis because it can automatically acquire meaningful representations from raw data. However, a technical challenge lies in the difficulty of determining which types of internal representation are associated with a specific task, because feature vectors can vary dynamically according to individual inputs. Here, based on the magnetic resonance imaging (MRI) of gliomas, we propose a novel method to extract a shareable set of feature vectors that encode various parts in tumor imaging phenotypes. By applying vector quantization to latent representations, features extracted by an encoder are replaced with a fixed set of feature vectors. Hence, the set of feature vectors can be used in downstream tasks as imaging markers, which we call deep radiomics. Using deep radiomics, a classifier is established using logistic regression to predict the glioma grade with 90% accuracy. We also devise an algorithm to visualize the image region encoded by each feature vector, and demonstrate that the classification model preferentially relies on feature vectors associated with the presence or absence of contrast enhancement in tumor regions. Our proposal provides a data-driven approach to enhance the understanding of the imaging appearance of gliomas.


Conflict of interest statement

K.K. and R.H. have received research funding from Fujifilm Corporation. M.M. and M.T. do not have any conflict of interest to be disclosed.

Figures

Figure 1
Figure 1
Obtaining a shareable set of feature vectors from a segmentation network. (a) A segmentation network consists of an encoder–decoder pair and stores a shareable set of feature vectors in a codebook. At the training stage of a tumor segmentation pre-task, an input image x is mapped onto a latent representation ze through the encoder. Vector quantization is performed based on the codebook e by replacing each feature vector in ze with the nearest codeword to produce a quantized latent representation zq. Then, the decoder produces a segmentation output by taking zq as the input. The error between the segmentation output and a ground-truth label is evaluated to train the network. (b) During the training, the codebook loss Lcodebook enforces the codebook variables toward the encoder’s output, meanwhile the commitment loss Lcommit exerts the opposite effect. To alter the configuration of the codebook, the encoder’s output is updated for the next forward pass according to the learning objective zLtotal. (c) When using the shareable set of feature vectors in a downstream task, the encoder is employed as a feature extractor. The latent representation of an input image is mapped onto the quantized latent representation zq, and then a histogram representation is constructed. This histogram representation contains information on the frequency with which each feature vector appears in the input image.
Figure 2
Figure 2
Overview of feature ablation study conducted to visualize the image region encoded by each feature vector. (a) The input image is initially mapped onto the quantized latent representation zq through the encoder, which functions as a feature extractor. This initial latent representation is subsequently fed into the decoder to generate the segmentation output y^, and the logit map y~ obtained before the final argmax operation is retained in the subsequent procedure. Then, the feature vector of interest in zq is replaced with a background vector to generate the replaced latent representation zq. The background vector is identified as the most common feature vector in the background of the images (that is, the region outside the body). Next, the decoder outputs the logit map y~ again by taking zq as the input. Because the difference between y~ and y~ reflects the image region affected by the replacement, the difference map is referred to as the responsible region of the feature vector of interest. (b) The two responsible regions corresponding to the HGG responsible vectors are shown along with examples of an input image, ground-truth label, and segmentation output. By collecting the responsible regions from all responsible vectors for a particular glioma grade, we can observe the relation between the type of imaging characteristics and glioma grade.
Figure 3
Figure 3
Average histogram representation for patients with (a) HGG and (b) LGG.
Figure 4
Figure 4
Assessment of the robustness of deep radiomics. Each perturbation such as pixel intensity scale and shift was applied to input images with the magnitudes in the range between 0.0 and 1.0 in increments of 0.1. (a) Difference ratio according to pixel intensity scale. (b) Difference ratio according to pixel intensity shift. (c) Classification performances (accuracy: blue, precision: orange, recall (sensitivity): gray, specificity: yellow, and negative predictive value: light blue) according to pixel intensity scale. (d) The same classification performances according to pixel intensity shift. See the performance degradation owing to the pixel intensity shift worsened when the magnitude exceeds more than 0.6. For all the data points, mean ± standard deviation is indicated.
Figure 5
Figure 5
Example results for responsible regions in HGG patients. For patients with HGG, the Gd-enhanced T1 (T1CE) and FLAIR sequences, ground-truth labels, segmentation outputs, HGG responsible regions, and LGG responsible regions are shown. The tumor regions are adequately correlated with the HGG responsible regions, but overlap with the LGG responsible regions is scarce. The color map indicates the high-difference values in red and the lower-difference values in blue; the values are standardized for each patient.
Figure 6
Figure 6
Example results for responsible regions in LGG patients. For patients with LGG, the Gd-enhanced T1 (T1CE) and FLAIR sequences, ground-truth labels, segmentation outputs, HGG responsible regions, and LGG responsible regions are shown. The tumor regions are strongly correlated with the LGG responsible regions, particularly in the central area of the tumor. The overlap with the HGG responsible regions is relatively insignificant and peripherally distributed at best. The color map indicates the high-difference values in red and the low-difference values in blue; the values are standardized for each patient.
Figure 7
Figure 7
Quantitative evaluation of overlap between responsible regions and segmentation labels. (a) Difference values of HGG responsible regions in each segmentation label: Gd-enhanced tumor (ET), peritumoral edema (ED), and necrotic and non-enhancing tumor core (NET). The values in the ET region are the highest among the three segmentation categories. (b) Difference values of LGG responsible regions for the same segmentation labels. The NET regions have the highest values; * indicates a statistical significance <0.0001.

Similar articles

Cited by

References

    1. Liu, S. et al. Actionable attribution maps for scientific machine learning. In International Conference on Machine Learning (ICML) Workshop on ML Interpretability for Scientific Discovery (2020).
    1. Wesseling P, Capper D. WHO 2016 classification of gliomas. Neuropathol. Appl. Neurobiol. 2018;44:139–150. doi: 10.1111/nan.12432. - DOI - PubMed
    1. DeAngelis LM. Brain tumors. N. Engl. J. Med. 2001;344:114–123. doi: 10.1056/NEJM200101113440207. - DOI - PubMed
    1. Louis DN, et al. The 2016 world health organization classification of tumors of the central nervous system: A summary. Acta Neuropathol. 2016;131:803–820. doi: 10.1007/s00401-016-1545-1. - DOI - PubMed
    1. The Cancer Genome Atlas Research Network Comprehensive, integrative genomic analysis of diffuse lower-grade gliomas. N. Engl. J. Med. 2015;372:2481–2498. doi: 10.1056/NEJMoa1402121. - DOI - PMC - PubMed

Publication types