. 2021 Jun;3(6):774-785.
doi: 10.1038/s42255-021-00407-6. Epub 2021 May 25.

Acute and long-term disruption of glycometabolic control after SARS-CoV-2 infection

Affiliations

Acute and long-term disruption of glycometabolic control after SARS-CoV-2 infection

Laura Montefusco et al. Nat Metab. 2021 Jun.

Abstract

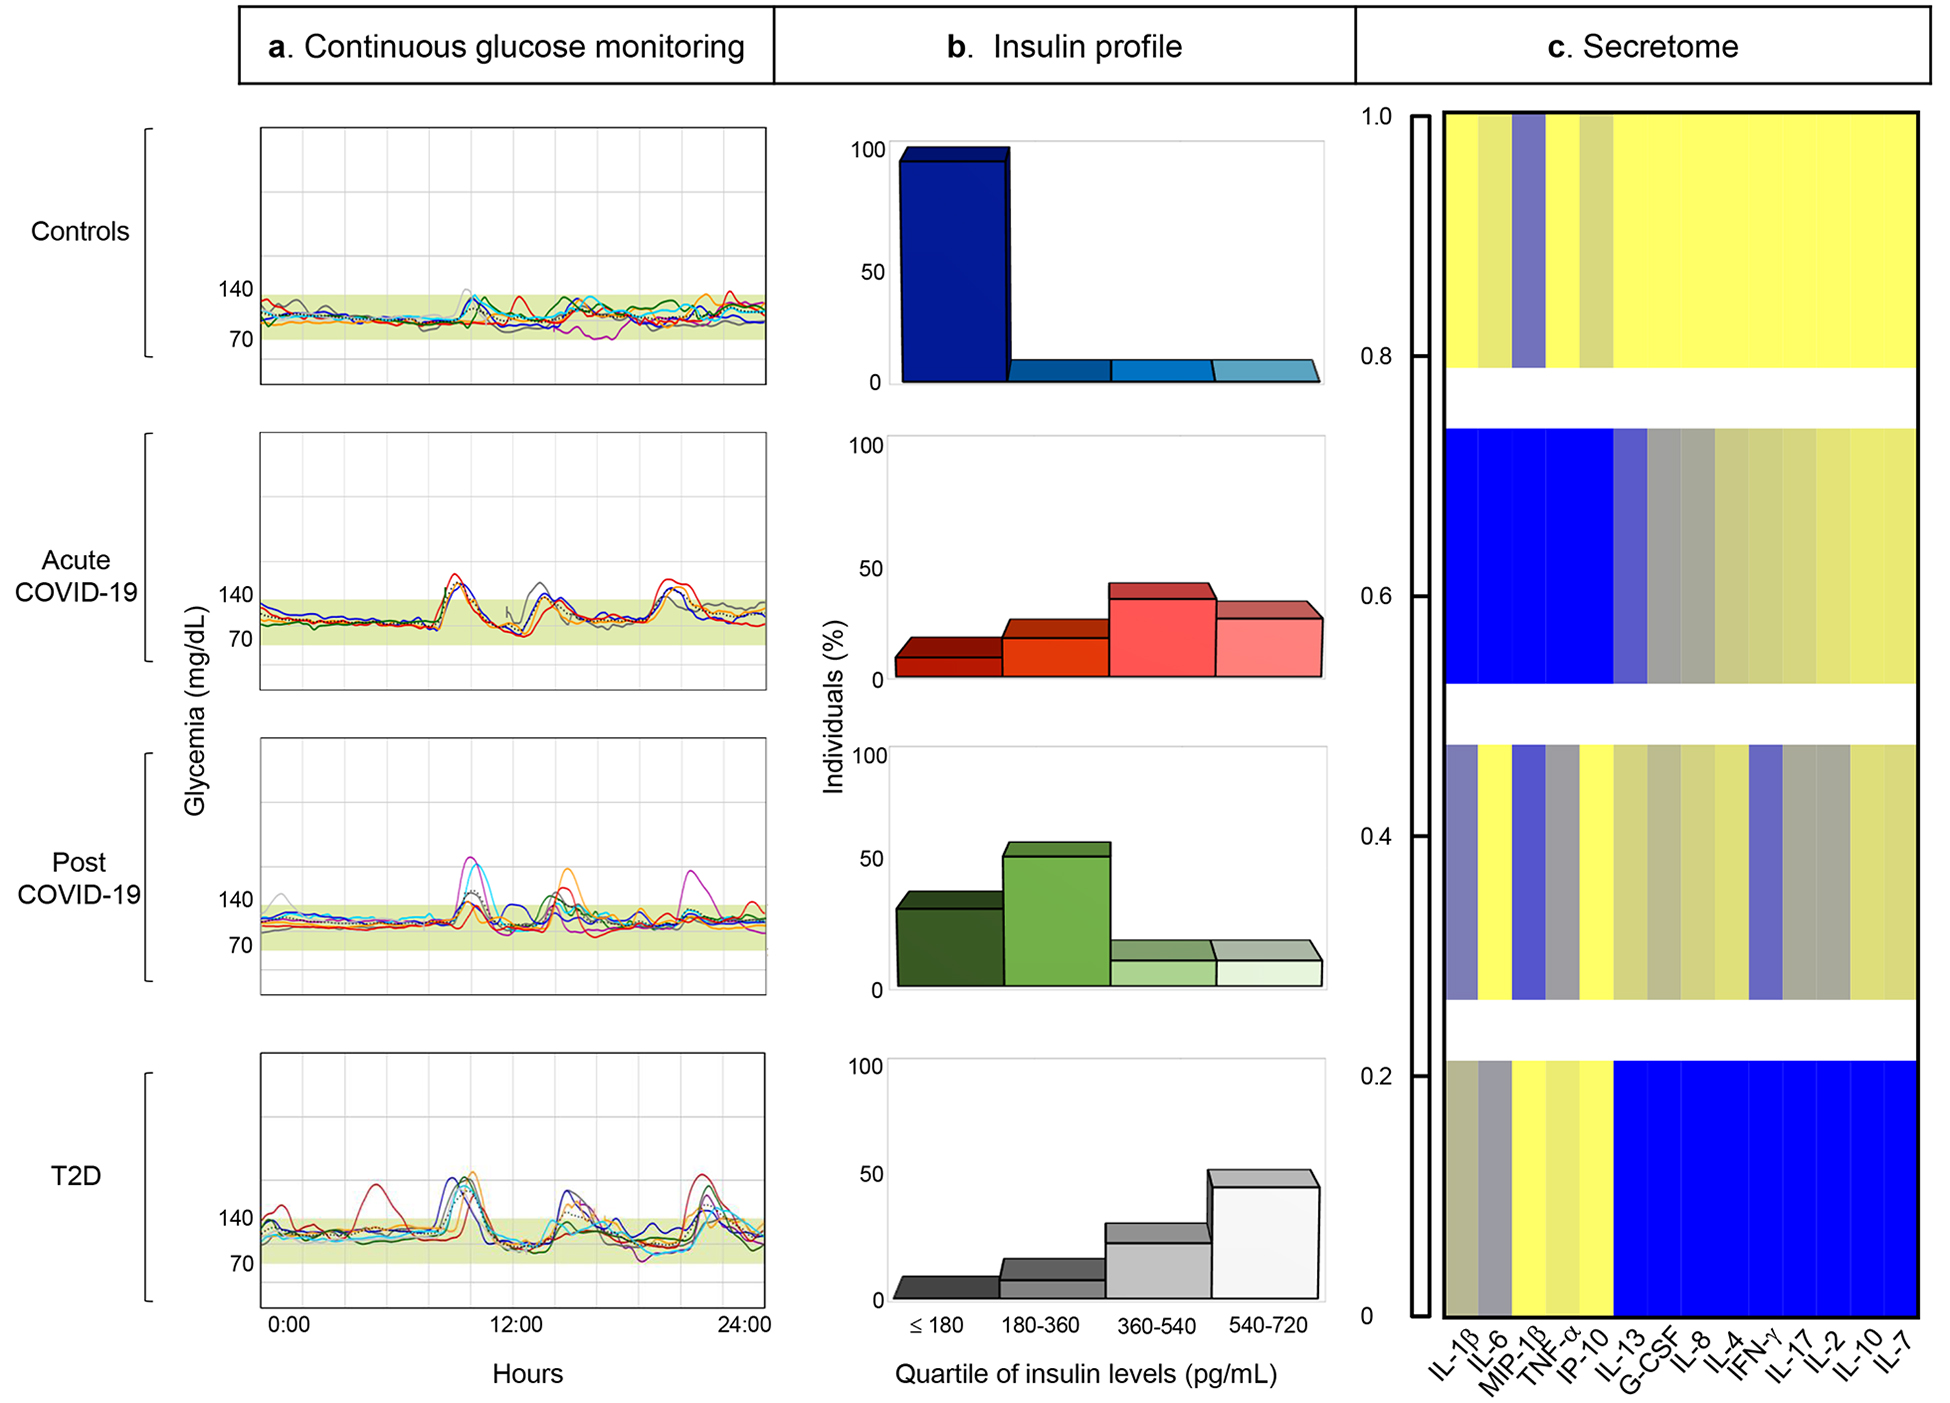
Patients with coronavirus disease 2019 (COVID-19) are reported to have a greater prevalence of hyperglycaemia. Cytokine release as a consequence of severe acute respiratory syndrome coronavirus 2 infection may precipitate the onset of metabolic alterations by affecting glucose homeostasis. Here we describe abnormalities in glycometabolic control, insulin resistance and beta cell function in patients with COVID-19 without any pre-existing history or diagnosis of diabetes, and document glycaemic abnormalities in recovered patients 2 months after onset of disease. In a cohort of 551 patients hospitalized for COVID-19 in Italy, we found that 46% of patients were hyperglycaemic, whereas 27% were normoglycaemic. Using clinical assays and continuous glucose monitoring in a subset of patients, we detected altered glycometabolic control, with insulin resistance and an abnormal cytokine profile, even in normoglycaemic patients. Glycaemic abnormalities can be detected for at least 2 months in patients who recovered from COVID-19. Our data demonstrate that COVID-19 is associated with aberrant glycometabolic control, which can persist even after recovery, suggesting that further investigation of metabolic abnormalities in the context of long COVID is warranted.


Conflict of interest statement

Competing interests

The authors declare no competing interests.

Figures

Figure 1.
Figure 1.. Increased rate of new-onset hyperglycemia in patients with COVID-19.
(a) Glycometabolic abnormalities in a cohort of 551 patients with COVID-19 (Acute COVID-19) at hospital admission, and (b) glycemic alterations for the hyperglycemic group at 6 months follow-up from their hospital discharge (Post COVID-19). (c-d) Mean HbA1c levels and mean peak blood glucose level were evaluated in diabetic, new-onset hyperglycemic and normoglycemic patients. (e) Survival rates of the 3 groups of patients (diabetic, new-onset hyperglycemic and normoglycemic) represented as time to clinical endpoint analysis, showing an increase in mortality in the diabetic group as compared to the hyperglycemic and normoglycemic groups. (f-g) Time to hospital discharge and clinical score at hospital admission in the 3 patient groups. (h-j) Rate of oxygen requirement, ventilatory support and need for intensive care were also reported and compared in the diabetic, hyperglycemic and normoglycemic groups; dark grey rectangles: diabetic individuals, light grey rectangles: hyperglycemic individuals and white rectangles: normoglycemic individuals. (k) Forest plots comparing the odds ratio of the clinical outcomes (oxygen support, ventilatory support and need for intensive care) between the hyperglycemic and the normoglycemic groups, after adjusting for age and sex. Bar plots in (a-b) represent the proportion of Diabetic, Hyperglycemic and Normoglycemic individuals. Scatter dot plots in (c-d) represent the mean±SEM the error bars represent the SEM, and each dot represent an individual sample (Diabetic (black, n=146), Hyperglycemic (dark grey, n=249), Normoglycemic (light grey, n=140). Survival curve in (e) represents the proportions of individuals at risk who are still alive at regular intervals, up to 30 days from admission and stratified by their glycemic status [(Diabetic (grey lines), Hyperglycemic (blue lines) and Normoglycemic (green lines)]. Bar graphs shown in (f-g) represent respectively the mean±SEM with the error bars represent the SEM. In (f) Diabetic (black, n=151), Hyperglycemic (dark grey, n=253) and Normoglycemic (light grey, n=147) individuals and in (g) Diabetic (dark grey bars, n=144), Hyperglycemic (light grey bars, n=247) and Normoglycemic (white bars, n=140) individuals. Stacked bar graphs in (h-j) represent proportions of patients requiring or not oxygen support (Diabetic n=146, Hyperglycemic n=221 and Normoglycemic n=126), ventilatory support (Diabetic n=146, Hyperglycemic n=219 and Normoglycemic n=149), intensive care need (Diabetic n=143, Hyperglycemic n=218 and Normoglycemic n=128). Log-rank (Mantel Cox) test (e), one-way ANOVA with Holm-Sidak correction (c, d, f) or Kruskal-Wallis with Dunn’s correction (g), two-sided Fisher’s/Chi square test (h, i, j) and logistic multivariable regression (k) were used for statistical analysis. Abbreviations. COVID-19, Coronavirus Disease 2019; HbA1c, Hemoglobin A1c; O2, oxygen; VS, ventilatory support; ICU, intensive care unit; CI, confidence interval.
Figure 2.
Figure 2.. Continuous glucose monitoring demonstrated glycemic abnormalities in patients with COVID-19.
(a) Duration of glycemia measured above 140 mg/dL, (b) AUC of glycemia levels above 140 mg/dL; (c) mean postprandial glycemia at 60 minutes, (d) mean postprandial glycemia at 120 minutes, (e) coefficient of variability, (f) standard deviation, (g) mean glycemia values and (h) nadir blood glucose in healthy controls, in patients with COVID-19 (Acute COVID-19), in patients who recovered from COVID-19 (Post COVID-19) and in patients with T2D. Data are depicted using box plots and whiskers where the upper and lower bounds of the boxes represent the interquartile ranges. The horizontal line inside each box reflect the median and the whiskers indicate minimum and maximum values. Each dot represents an individual sample (Controls (blue), COVID-19 (maroon) and post-COVID-19 (moss)). Ordinary one-way ANOVA test with Bonferroni correction was used when applicable for calculating statistical significance between all groups. Data are representative of n=12 samples analyzed for controls, n=8 (except for e, n=7) for Acute COVID-19, n=8 for Post COVID-19 and n=10 for patients with T2D. T2D group (shown in grey) is included for visual comparison only, ie it was not included in the statistical analysis. Abbreviations. COVID-19, Coronavirus Disease 2019; AUC, area under the curve; T2D, type 2 diabetes.
Figure 3.
Figure 3.. Persistent insulin resistance and β-cell dysfunction are evident in patients with COVID-19.
(a) Mean fasting insulin, (b) mean fasting proinsulin, (c) fasting insulin to proinsulin ratio, (d) fasting C-peptide levels, (e) HOMA-B and (f) HOMA-IR are shown for healthy controls, for patients with COVID-19 (Acute COVID-19), for patients who recovered from COVID-19 (Post COVID-19) and for patients with T2D. (g) AIRmax, (h-i) mean AUC of insulin and C-peptide after arginine test are shown for healthy controls, for Acute COVID-19, or for Post COVID-19 and for patients with T2D. Data are depicted using box plots and whiskers where the upper and lower bounds of the boxes represent the interquartile ranges. The horizontal line inside each box reflect the median and the whiskers indicate minimum and maximum values. Each dot represents an individual sample (Controls (blue), COVID-19 (maroon) and Post COVID-19 (moss). Ordinary one-way ANOVA test with Bonferroni correction was used when applicable for calculating statistical significance between all groups. Data are representative of n=15 (except for e, n=10) samples analyzed for controls, n=10 (except for e, n=8) for Acute COVID-19, n=10 (except fore, n=7) for Post COVID-19 and n=10 (except for g, n=7) for patients with T2D. T2D group (shown in grey) is included for visual comparison only, ie it was not included in the statistical analysis. Abbreviations. COVID-19, Coronavirus Disease 2019; T2D, type 2 diabetes; AU, arbitrary unit; HOMA-B, homeostasis model assessment of β-cell dysfunction; HOMA-IR; homeostasis model assessment of insulin resistance; AIR-max, maximal acute insulin response; AUC, area under the curve.
Figure 4.
Figure 4.. Changes in the secretome are detected long after recovery from COVID-19.
(a-n) The peripheral levels of 14 circulating cytokines (IL-1β, IL-2, IL-4, IL-6, IL-7, IL-8, IL-10, IL-13, IL-17, G-CSF, MIP-1β, , IFN-γ, TNF-α and IP-10) were assessed by a Luminex assay using the serum of healthy controls, patients with COVID-19 (Acute COVID-19) and, patients who recovered from COVID-19 (Post COVID-19) and patients with T2D. Data are represented as scatter dot plots showing the mean±SEM. Each dot represents an individual sample (Controls (blue), COVID-19 (maroon) and Post COVID-19 (moss). Statistical significance was determined by unpaired Kruskal-Wallis test. Data are representative of n=14 (except for n, n=4) samples analyzed for controls, n=9 (except for n, n=5) for patients with Acute COVID-19, n=10 (except for n, n=8) for patients with Post COVID-19 and n=10 for patients with T2D. T2D group (shown in grey) is included for visual comparison only, ie it was not included in the statistical analysis. Abbreviations. COVID-19, Coronavirus Disease 2019; T2D, type 2 diabetes; IL-, Interleukin; G-CSF, Granulocyte-colony stimulating factor; MIP-1β, Macrophage inflammatory protein-1 beta; IFN-γ, Interferon gamma; TNF-α, Tumor Necrosis Factor; IP-10, Interferon gamma-induced protein 10.
Figure 5.
Figure 5.. Evidence of glycometabolic, hormonal and secretome abnormalities in patients with COVID-19.
Comparative schematic/analysis showing abnormalities in (a) continuous glucose monitoring, (b) insulin levels and (c) secretome profile in patients with COVID-19 (Acute COVID-19), in those who recovered from COVID-19 (Post COVID-19) and in patients with T2D, demonstrating similarities with those found in patients with T2D. Data in (c) are represented as color-coded values showing the average of serum cytokine mean-normalized levels in each group, normalized across groups. Abbreviations. COVID-19, Coronavirus Disease 2019; T2D; type 2 diabetes; IL-, Interleukin; G-CSF, Granulocyte-colony stimulating factor; MIP-1β, Macrophage inflammatory protein-1 beta; IFN-γ, Interferon gamma; TNF-α, Tumor Necrosis Factor; IP-10, Interferon gamma-induced protein 10.

Comment in

References

    1. Xu B, Kraemer MUG & Open, C.-D. C. G. Open access epidemiological data from the COVID-19 outbreak. Lancet Infect Dis 20, 534, doi:10.1016/S1473-3099(20)30119-5 (2020). - DOI - PMC - PubMed
    1. Tay MZ, Poh CM, Renia L, MacAry PA & Ng LFP The trinity of COVID-19: immunity, inflammation and intervention. Nat Rev Immunol 20, 363–374, doi:10.1038/s41577-020-03118 (2020). - DOI - PMC - PubMed
    1. Hu B, Guo H, Zhou P & Shi ZL Characteristics of SARS-CoV-2 and COVID-19. Nat Rev Microbiol, doi:10.1038/s41579-020-00459-7 (2020). - DOI - PMC - PubMed
    1. Deng SQ & Peng HJ Characteristics of and Public Health Responses to the Coronavirus Disease 2019 Outbreak in China. J Clin Med 9, doi:10.3390/jcm9020575 (2020). - DOI - PMC - PubMed
    1. Chen N et al. Epidemiological and clinical characteristics of 99 cases of 2019 novel coronavirus pneumonia in Wuhan, China: a descriptive study. Lancet 395, 507–513, doi:10.1016/S01406736(20)30211-7 (2020). - DOI - PMC - PubMed

Publication types