. 2021 Nov:263:109175.
doi: 10.1016/j.biocon.2021.109175. Epub 2021 May 20.

Global COVID-19 lockdown highlights humans as both threats and custodians of the environment

Amanda E Bates  1 Richard B Primack  2 Brandy S Biggar  1 Tomas J Bird  3 Mary E Clinton  1 Rylan J Command  4 Cerren Richards  1 Marc Shellard  5 Nathan R Geraldi  5 Valeria Vergara  6 Orlando Acevedo-Charry  7 Zuania Colón-Piñeiro  8 David Ocampo  7 Natalia Ocampo-Peñuela  9 Lina M Sánchez-Clavijo  9 Cristian M Adamescu  10 Sorin Cheval  11 Tudor Racoviceanu  10 Matthew D Adams  12 Egide Kalisa  12 Vincent Z Kuuire  12 Vikram Aditya  13 Pia Anderwald  14 Samuel Wiesmann  14 Sonja Wipf  14 Gal Badihi  15 Matthew G Henderson  15 Hanspeter Loetscher  16 Katja Baerenfaller  17 Lisandro Benedetti-Cecchi  18 Fabio Bulleri  18 Iacopo Bertocci  18 Elena Maggi  18 Luca Rindi  18 Chiara Ravaglioli  18 Kristina Boerder  19 Julien Bonnel  20 Delphine Mathias  21 Philippe Archambault  22 Laurent Chauvaud  23 Camrin D Braun  24 Simon R Thorrold  24 Jacob W Brownscombe  25 Jonathan D Midwood  25 Christine M Boston  25 Jill L Brooks  26 Steven J Cooke  26 Victor China  27 Uri Roll  27 Jonathan Belmaker  28   29 Assaf Zvuloni  30 Marta Coll  31 Miquel Ortega  32 Brendan Connors  33 Lisa Lacko  33 Dinusha R M Jayathilake  34 Mark J Costello  35 Theresa M Crimmins  36 LoriAnne Barnett  36 Ellen G Denny  36 Katharine L Gerst  36 R L Marsh  36 Erin E Posthumus  36 Reilly Rodriguez  36 Alyssa Rosemartin  36 Sara N Schaffer  36 Jeff R Switzer  36 Kevin Wong  36 Susan J Cunningham  37 Petra Sumasgutner  38 Arjun Amar  37 Robert L Thomson  37 Miqkayla Stofberg  37 Sally Hofmeyr  37 Jessleena Suri  37 Rick D Stuart-Smith  39 Paul B Day  40 Graham J Edgar  39 Antonia T Cooper  39 Fabio Cabrera De Leo  41   42 Grant Garner  42 Paulson G Des Brisay  43 Michael B Schrimpf  44 Nicola Koper  44 Michael S Diamond  45 Ross G Dwyer  46 Cameron J Baker  47 Craig E Franklin  47 Ron Efrat  27 Oded Berger-Tal  27 Ohad Hatzofe  48 Víctor M Eguíluz  49 Jorge P Rodríguez  50 Juan Fernández-Gracia  49 David Elustondo  51 Vicent Calatayud  52 Philina A English  53 Stephanie K Archer  54 Sarah E Dudas  53 Dana R Haggarty  53 Austin J Gallagher  55 Brendan D Shea  55 Oliver N Shipley  55 Ben L Gilby  46 Jasmine Ballantyne  46 Andrew D Olds  46 Christopher J Henderson  46 Thomas A Schlacher  46 William D Halliday  56 Nicholas A W Brown  42 Mackenzie B Woods  42 Sigal Balshine  57 Francis Juanes  42 Mitchell J Rider  58 Patricia S Albano  58 Neil Hammerschlag  58 Graeme C Hays  59 Nicole Esteban  60 Yuhang Pan  61 Guojun He  62 Takanao Tanaka  61 Marc J S Hensel  63 Robert J Orth  63 Christopher J Patrick  63 Jonas Hentati-Sundberg  64 Olof Olsson  65 Margot L Hessing-Lewis  66 Nicholas D Higgs  67 Mark A Hindell  68 Clive R McMahon  69 Rob Harcourt  70 Christophe Guinet  71 Sarah E Hirsch  72 Justin R Perrault  72 Shelby R Hoover  72 Jennifer D Reilly  72 Catherine Hobaiter  15 Thibaud Gruber  73 Charlie Huveneers  74 Vinay Udyawer  75 Thomas M Clarke  74 Laura P Kroesen  76 David S Hik  76 Seth G Cherry  77 Justin A Del Bel Belluz  78 Jennifer M Jackson  78 Shengjie Lai  79 Clayton T Lamb  80 Gregory D LeClair  81 Jeffrey R Parmelee  82 Matthew W H Chatfield  83 Cheryl A Frederick  83 Sangdon Lee  84 Hyomin Park  84 Jaein Choi  84 Frédéric LeTourneux  85 Thierry Grandmont  85 Frédéric Dulude de-Broin  85 Joël Bêty  86 Gilles Gauthier  85 Pierre Legagneux  85   71 Jesse S Lewis  87 Jeffrey Haight  88 Zhu Liu  89 Jarod P Lyon  90 Robin Hale  90 Dallas D'Silva  91 Ian MacGregor-Fors  92 Enrique Arbeláez-Cortés  93 Felipe A Estela  94 Camilo E Sánchez-Sarria  94 Michelle García-Arroyo  92 Giann K Aguirre-Samboní  94 Juan C Franco Morales  95 Shahar Malamud  28 Tal Gavriel  28 Yehezkel Buba  28 Shira Salingré  28 Mai Lazarus  28 Ruthy Yahel  96 Yigael Ben Ari  96 Eyal Miller  96 Rotem Sade  96 Guy Lavian  96 Ziv Birman  96 Manor Gury  96 Harel Baz  96 Ilia Baskin  96 Alon Penn  96 Amit Dolev  96 Ogen Licht  96 Tabi Karkom  96 Sharon Davidzon  96 Avi Berkovitch  96 Ofer Yaakov  96 Raoul Manenti  97 Emiliano Mori  98 Gentile Francesco Ficetola  97 Enrico Lunghi  99 David March  100 Brendan J Godley  100 Cecilia Martin  5 Steven F Mihaly  101 David R Barclay  102 Dugald J M Thomson  102 Richard Dewey  101 Jeannette Bedard  101 Aroha Miller  6 Amber Dearden  6 Jennifer Chapman  6 Lauren Dares  6 Laura Borden  6 Donna Gibbs  6 Jessica Schultz  6 Nikita Sergeenko  6 Fiona Francis  6 Amanda Weltman  6 Nicolas Moity  103 Jorge Ramírez-González  103 Gonzalo Mucientes  104 Alexandre Alonso-Fernández  104 Itai Namir  28 Avi Bar-Massada  105 Ron Chen  106 Shmulik Yedvab  107 Thomas A Okey  108 Steffen Oppel  109 Volen Arkumarev  110 Samuel Bakari  111 Vladimir Dobrev  110 Victoria Saravia-Mullin  112 Anastasios Bounas  112 Dobromir Dobrev  110 Elzbieta Kret  113 Solomon Mengistu  114 Cloé Pourchier  115 Alazar Ruffo  116 Million Tesfaye  117 Mengistu Wondafrash  114 Stoyan C Nikolov  110 Charles Palmer  118 Lorenzo Sileci  118 Patrick T Rex  119 Christopher G Lowe  119 Francesc Peters  120 Matthew K Pine  121 Craig A Radford  122 Louise Wilson  122 Lauren McWhinnie  123 Alessia Scuderi  124 Andrew G Jeffs  122 Kathleen L Prudic  125 Maxim Larrivée  126 Kent P McFarland  127 Rodrigo Solis  128 Rebecca A Hutchinson  129 Nuno Queiroz  130 Miguel A Furtado  130 David W Sims  131 Emily Southall  131 Claudio A Quesada-Rodriguez  132 Jessica P Diaz-Orozco  132 Ku'ulei S Rodgers  133 Sarah J L Severino  133 Andrew T Graham  133 Matthew P Stefanak  133 Elizabeth M P Madin  133 Peter G Ryan  37 Kyle Maclean  37 Eleanor A Weideman  37 Çağan H Şekercioğlu  134 Kyle D Kittelberger  134 Josip Kusak  135 Jeffrey A Seminoff  136 Megan E Hanna  137 Takahiro Shimada  138 Mark G Meekan  139 Martin K S Smith  140 Mohlamatsane M Mokhatla  140 Malcolm C K Soh  141 Roanna Y T Pang  141 Breyl X K Ng  141 Benjamin P Y-H Lee  141 Adrian H B Loo  141 Kenneth B H Er  141 Gabriel B G Souza  142 Christopher D Stallings  143 Joseph S Curtis  143 Meaghan E Faletti  143 Jonathan A Peake  143 Michael J Schram  143 Kara R Wall  143 Carina Terry  2 Matt Rothendler  2 Lucy Zipf  2 Juan Sebastián Ulloa  9 Angélica Hernández-Palma  9 Bibiana Gómez-Valencia  9 Cristian Cruz-Rodríguez  9 Yenifer Herrera-Varón  9 Margarita Roa  9 Susana Rodríguez-Buriticá  9 Jose Manuel Ochoa-Quintero  9 Reut Vardi  144 Víctor Vázquez  145 Christian Requena-Mesa  146 Miyako H Warrington  147 Michelle E Taylor  148 Lucy C Woodall  149 Paris V Stefanoudis  149 Xiangliang Zhang  150 Qiang Yang  150 Yuval Zukerman  27 Zehava Sigal  48 Amir Ayali  151 Eric E G Clua  152 Pamela Carzon  152 Clementine Seguine  152 Andrea Corradini  153 Luca Pedrotti  154 Catherine M Foley  133 Catherine Alexandra Gagnon  85 Elijah Panipakoochoo  155 Celene B Milanes  156 Camilo M Botero  157 Yunior R Velázquez  158 Nataliya A Milchakova  159 Simon A Morley  160 Stephanie M Martin  161 Veronica Nanni  162 Tanya Otero  163 Julia Wakeling  163 Sarah Abarro  164 Cyril Piou  165 Ana F L Sobral  166 Eulogio H Soto  167 Emily G Weigel  168 Alejandro Bernal-Ibáñez  169 Ignacio Gestoso  169 Eva Cacabelos  169 Francesca Cagnacci  170 Reny P Devassy  171 Matthias-Claudio Loretto  172 Paula Moraga  173 Christian Rutz  174 Carlos M Duarte  5
Affiliations

Global COVID-19 lockdown highlights humans as both threats and custodians of the environment

Amanda E Bates et al. Biol Conserv. 2021 Nov.

Abstract

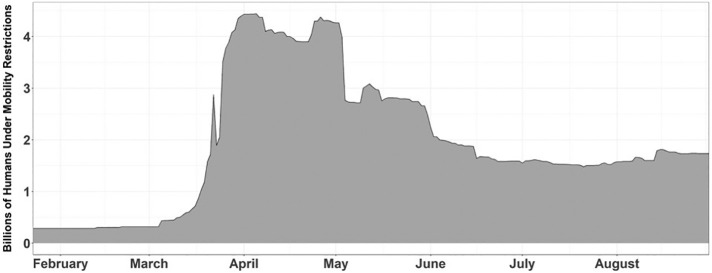
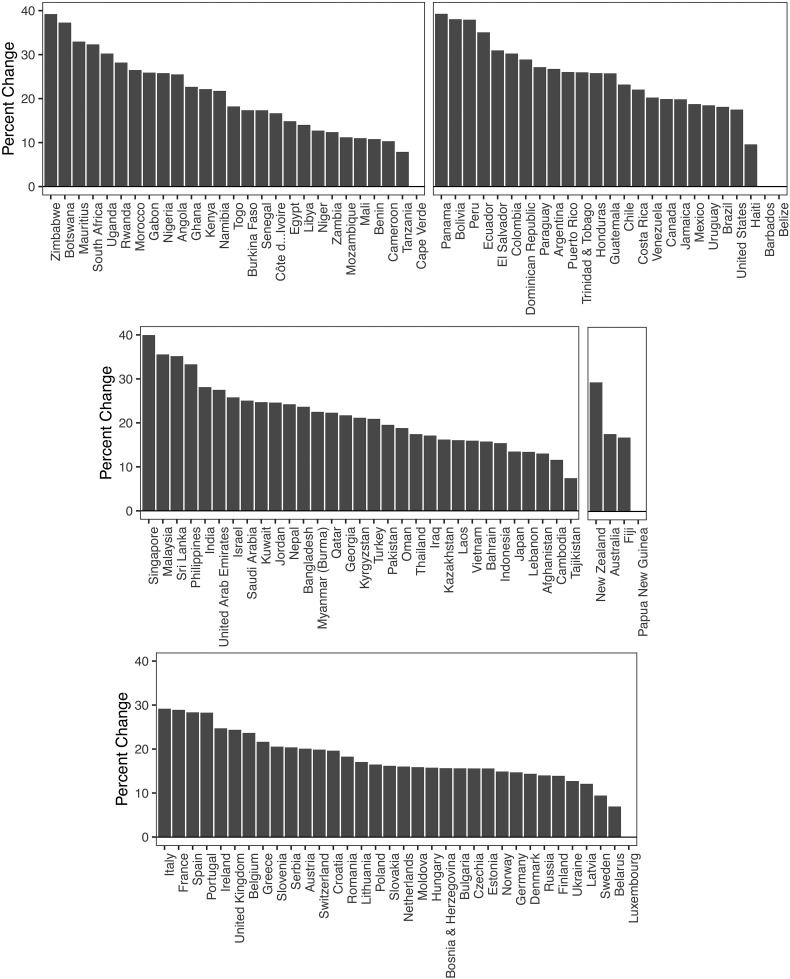
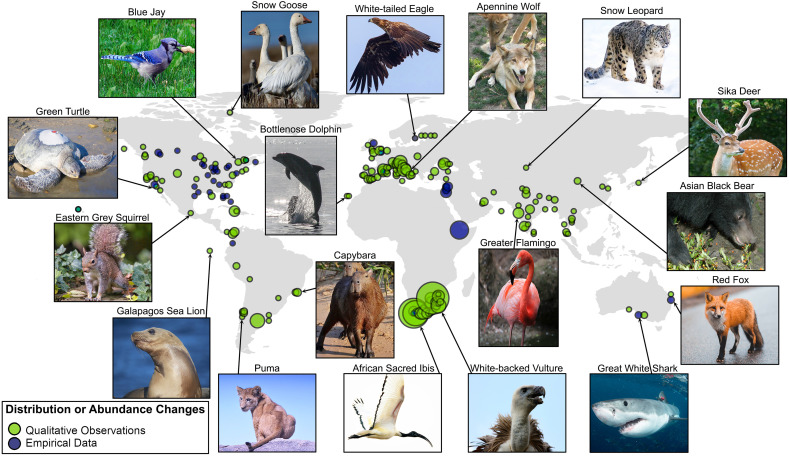
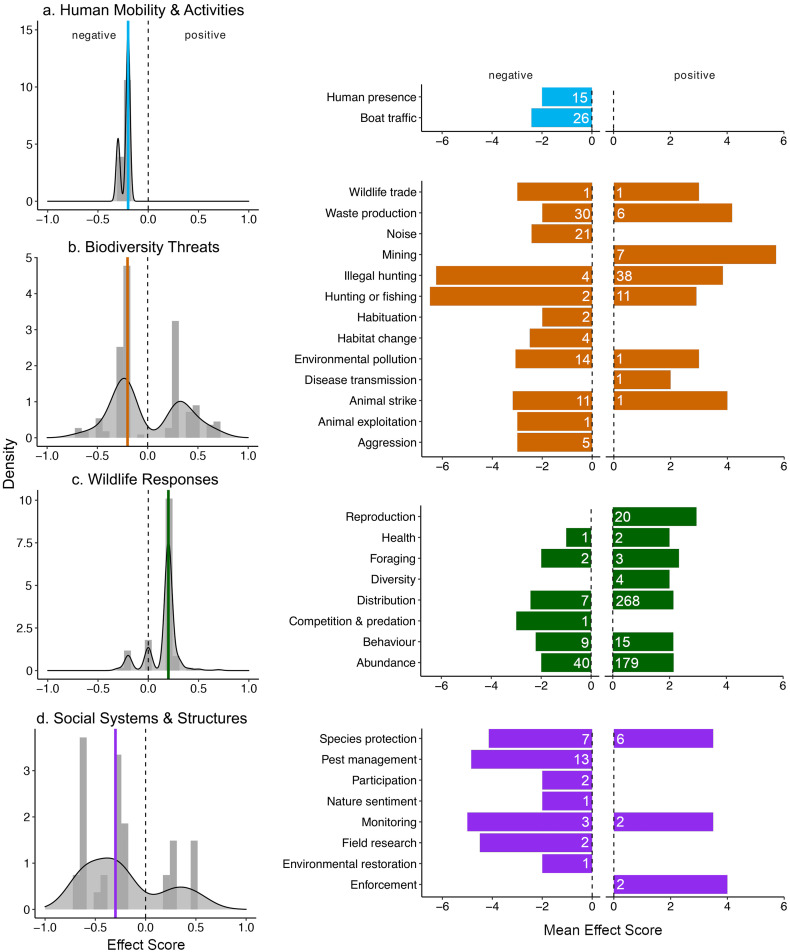
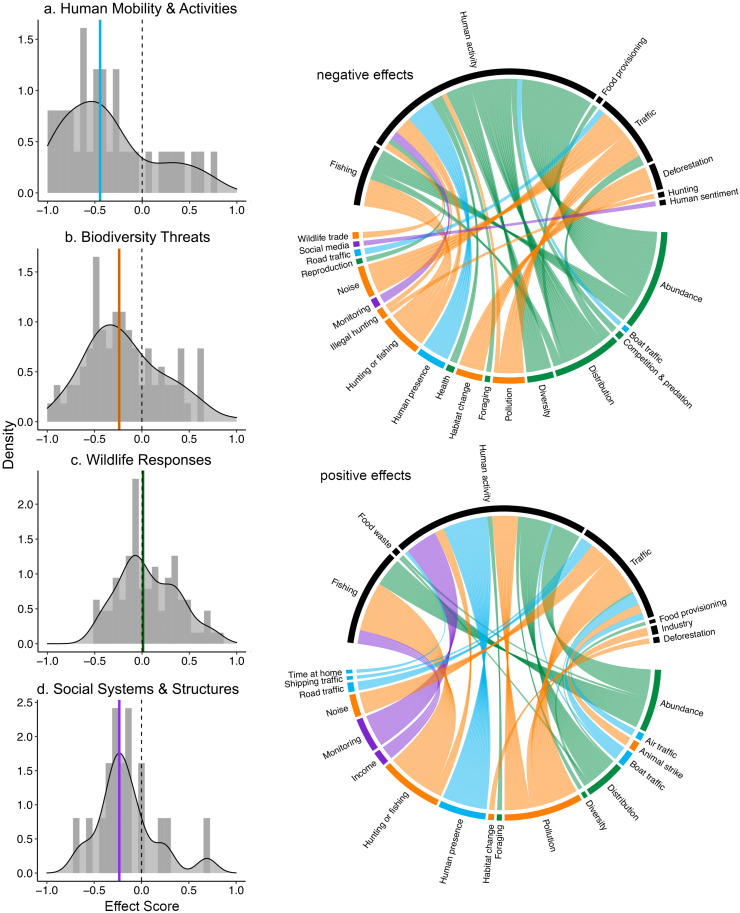
The global lockdown to mitigate COVID-19 pandemic health risks has altered human interactions with nature. Here, we report immediate impacts of changes in human activities on wildlife and environmental threats during the early lockdown months of 2020, based on 877 qualitative reports and 332 quantitative assessments from 89 different studies. Hundreds of reports of unusual species observations from around the world suggest that animals quickly responded to the reductions in human presence. However, negative effects of lockdown on conservation also emerged, as confinement resulted in some park officials being unable to perform conservation, restoration and enforcement tasks, resulting in local increases in illegal activities such as hunting. Overall, there is a complex mixture of positive and negative effects of the pandemic lockdown on nature, all of which have the potential to lead to cascading responses which in turn impact wildlife and nature conservation. While the net effect of the lockdown will need to be assessed over years as data becomes available and persistent effects emerge, immediate responses were detected across the world. Thus, initial qualitative and quantitative data arising from this serendipitous global quasi-experimental perturbation highlights the dual role that humans play in threatening and protecting species and ecosystems. Pathways to favorably tilt this delicate balance include reducing impacts and increasing conservation effectiveness.

Keywords: Biodiversity; Global monitoring; Pandemic; Restoration.


Conflict of interest statement

Authors declare no competing interests.

Figures

Fig. 1
Fig. 1
Total humans under COVID-19 mobility restrictions. Time series of the number of humans under lockdown across the global population under the 2020 COVID-19 mitigation policies. This assumes that in countries with targeted restrictions, a fraction of 20% of the population was under lockdown. Assuming different fractions, similar time patterns but different magnitudes of populations under lockdown are obtained. For example, assuming fractions of 20% and 30%, April 5th was the day with the maximum population under lockdown equal to 57% and 61% of the global population, respectively. Assuming fractions of 5% and 10%, April 26th was the day with the maximum population under lockdown equal to 53% and 54% of the population, respectively.
Fig. 2
Fig. 2
Change in mobility. Percent change in time spent within home residences (residential) following implementation of confinement measures in each country.
Fig. 3
Fig. 3
Reports of 275 species that occupied an unusual area (distribution change), or shifted in number (abundance change) were attributed to a reduction in human activities. Changes in species distributions were observed around the world as qualitative observations (Appendix 3, Table A3, albeit with biases in effort such as greater coverage in the Northern Hemisphere and South Africa), and based on empirical data of time series surveys and bio-logging data using statistical modeling to quantify change. Only changes that were attributed to the lockdown with high confidence are included here (Appendix 4, Table A4). Bubble size represents data density (the largest bubble represents 41–60 observations and the smallest is 1–20). Reports of 275 species that occupied an unusual area (distribution change), or shifted in number (abundance change) were attributed to a reduction in human activities. Changes in species distributions were observed around the world as qualitative observations (Appendix 3, Table A3, albeit with biases in effort such as greater coverage in the Northern Hemisphere and South Africa), and based on empirical data of time series surveys and bio-logging data using statistical modeling to quantify change. Only changes that were attributed to the lockdown with high confidence are included here (Appendix 4, Table A4). Bubble size represents data density (the largest bubble represents 41–60 observations and the smallest is 1–20).
Fig. 4
Fig. 4
Qualitative negative and positive effects observed which were relative to the response observed (Appendix 4, Table A4). Negative effects indicate a dampening in the responses which were grouped into categories representing “Human Mobility & Activities”, Biodiversity Threats”, “Wildlife Responses” and “Social Systems & Structures”, while positive effects indicate an increase. The effect score is based on the criteria outlined in Appendix 1, Table A2, and considered the duration, spatial extent and total impact of the effect on the response. A negative or positive effect direction is relative to each category is based on the observed effect, rather than an interpreted impact. For instance, a negative effect on noise is a decrease in noise (which may have had positive wildlife impacts). a) Distribution of effects showing the direction and magnitude. The dotted line is the intercept, and the colored line indicates the median effect score. b) The mean effect score for categories falling within effects on human activities (blue), biodiversity threats (orange), biodiversity (green) and social systems (purple). Bars are the mean across reports pooled for positive and negative effects on the y-axis category, and white numbers are the number of observations upon which the mean is based. (For interpretation of the references to colour in this figure legend, the reader is referred to the web version of this article.) Qualitative negative and positive effects observed which were relative to the response observed (Appendix 4, Table A4). Negative effects indicate a dampening in the responses which were grouped into categories representing “Human Mobility & Activities”, Biodiversity Threats”, “Wildlife Responses” and “Social Systems & Structures”, while positive effects indicate an increase. The effect score is based on the criteria outlined in Appendix 1, Table A2, and considered the duration, spatial extent and total impact of the effect on the response. A negative or positive effect direction is relative to each category is based on the observed effect, rather than an interpreted impact. For instance, a negative effect on noise is a decrease in noise (which may have had positive wildlife impacts). a) Distribution of effects showing the direction and magnitude. The dotted line is the intercept, and the colored line indicates the median effect score. b) The mean effect score for categories falling within effects on human activities (blue), biodiversity threats (orange), biodiversity (green) and social systems (purple). Bars are the mean across reports pooled for positive and negative effects on the y-axis category, and white numbers are the number of observations upon which the mean is based. (For interpretation of the references to colour in this figure legend, the reader is referred to the web version of this article.)
Fig. 5
Fig. 5
Responses during the lockdown based on our empirical data (Appendix 5, Table A5) where positive and negative effects represent the observed direction of change for the different response categories. 71 studies that attributed the observed effect to the lockdown with high confidence are included (i.e., a qualitative confidence score of 3 or greater out of a maximum of 5). Frequency histograms (panels a-d) show bars representing data density and a curve representing a smoothed distribution of effect sizes and direction. The dotted line is zero, and the solid colored line is the median. Only responses that were attributed to the lockdown with high confidence are included. a) Human activities and mobility (blue) includes measured responses in human activities and mobility, such as related to commuting and recreational activities (categories are described in Appendix 1, Table A1). b) Biodiversity threats (orange) include categories that harm wildlife and natural systems, such as hunting, fishing, mining, vehicle strikes, wildlife trade, environmental pollution, and deforestation. c) Wildlife responses (green) incorporate observations of animals and plants related to performance (e.g., reproduction, health, foraging) and habitat use (abundance and distribution) and community change (species richness). d) Social systems and structures (purple) include environmental monitoring, restoration, conservation, and enforcement. The chord diagrams highlighted the observed positive and negative effects which were attributed to different lockdown-related drivers as identified by each study (black), and linked to what was measured by each study where responses were grouped into: human activities and mobility, biodiversity threats, wildlife responses, and social systems and structures. One chord represents one measured response. (For interpretation of the references to colour in this figure legend, the reader is referred to the web version of this article.) Responses during the lockdown based on our empirical data (Appendix 5, Table A5) where positive and negative effects represent the observed direction of change for the different response categories. 71 studies that attributed the observed effect to the lockdown with high confidence are included (i.e., a qualitative confidence score of 3 or greater out of a maximum of 5). Frequency histograms (panels a-d) show bars representing data density and a curve representing a smoothed distribution of effect sizes and direction. The dotted line is zero, and the solid colored line is the median. Only responses that were attributed to the lockdown with high confidence are included. a) Human activities and mobility (blue) includes measured responses in human activities and mobility, such as related to commuting and recreational activities (categories are described in Appendix 1, Table A1). b) Biodiversity threats (orange) include categories that harm wildlife and natural systems, such as hunting, fishing, mining, vehicle strikes, wildlife trade, environmental pollution, and deforestation. c) Wildlife responses (green) incorporate observations of animals and plants related to performance (e.g., reproduction, health, foraging) and habitat use (abundance and distribution) and community change (species richness). d) Social systems (purple) include environmental monitoring, restoration, conservation, and enforcement. The chord diagrams highlighted the observed positive and negative effects which were attributed to different lockdown-related drivers as identified by each study (black), and linked to what was measured by each study where responses were grouped into the four categories: human activities and mobility, biodiversity threats, wildlife responses, and social systems and structures. One chord represents one measured response. (For interpretation of the references to colour in this figure legend, the reader is referred to the web version of this article.)

References

    1. Airoldi L., Beck M.W., Firth L.B., Bugnot A.B., Steinberg P.D., Dafforn K.A. Emerging solutions to return nature to the urban ocean. Annu. Rev. Mar. Sci. 2021;13:445–477. doi: 10.1146/annurev-marine-032020-020015. - DOI - PubMed
    1. Bao R., Zhang A. Does lockdown reduce air pollution? Evidence from 44 cities in northern China. Sci. Total Environ. 2020;731 doi: 10.1016/j.scitotenv.2020.139052. - DOI - PMC - PubMed
    1. Bates A.E., Primack R.B., Moraga P., Duarte C.M. COVID-19 pandemic and associated lockdown as a “Global Human Confinement Experiment” to investigate biodiversity conservation. Biol. Conserv. 2020;248 doi: 10.1016/j.biocon.2020.108665. - DOI - PMC - PubMed
    1. Bradley B.A., Laginhas B.B., Whitlock R., Allen J.M., Bates A.E., Bernatchez G., Diez J.M., Early R., Lenoir J., Vilà M., Sorte C.J.B. Disentangling the abundance–impact relationship for invasive species. Proc. Natl. Acad. Sci. 2019;116:9919–9924. doi: 10.1073/pnas.1818081116. - DOI - PMC - PubMed
    1. Corlett R.T., Primack R.B., Devictor V., Maas B., Goswami V.R., Bates A.E., Koh L.P., Regan T.J., Loyola R., Pakeman R.J., Cumming G.S., Pidgeon A., Johns D., Roth R. Impacts of the coronavirus pandemic on biodiversity conservation. Biol. Conserv. 2020;246 doi: 10.1016/j.biocon.2020.108571. - DOI - PMC - PubMed