

Comparison of spectral FRET microscopy approaches for single-cell analysis
- PMID: 34035557
- PMCID: PMC8142325
- DOI: 10.1117/12.2546308
Comparison of spectral FRET microscopy approaches for single-cell analysis
Abstract
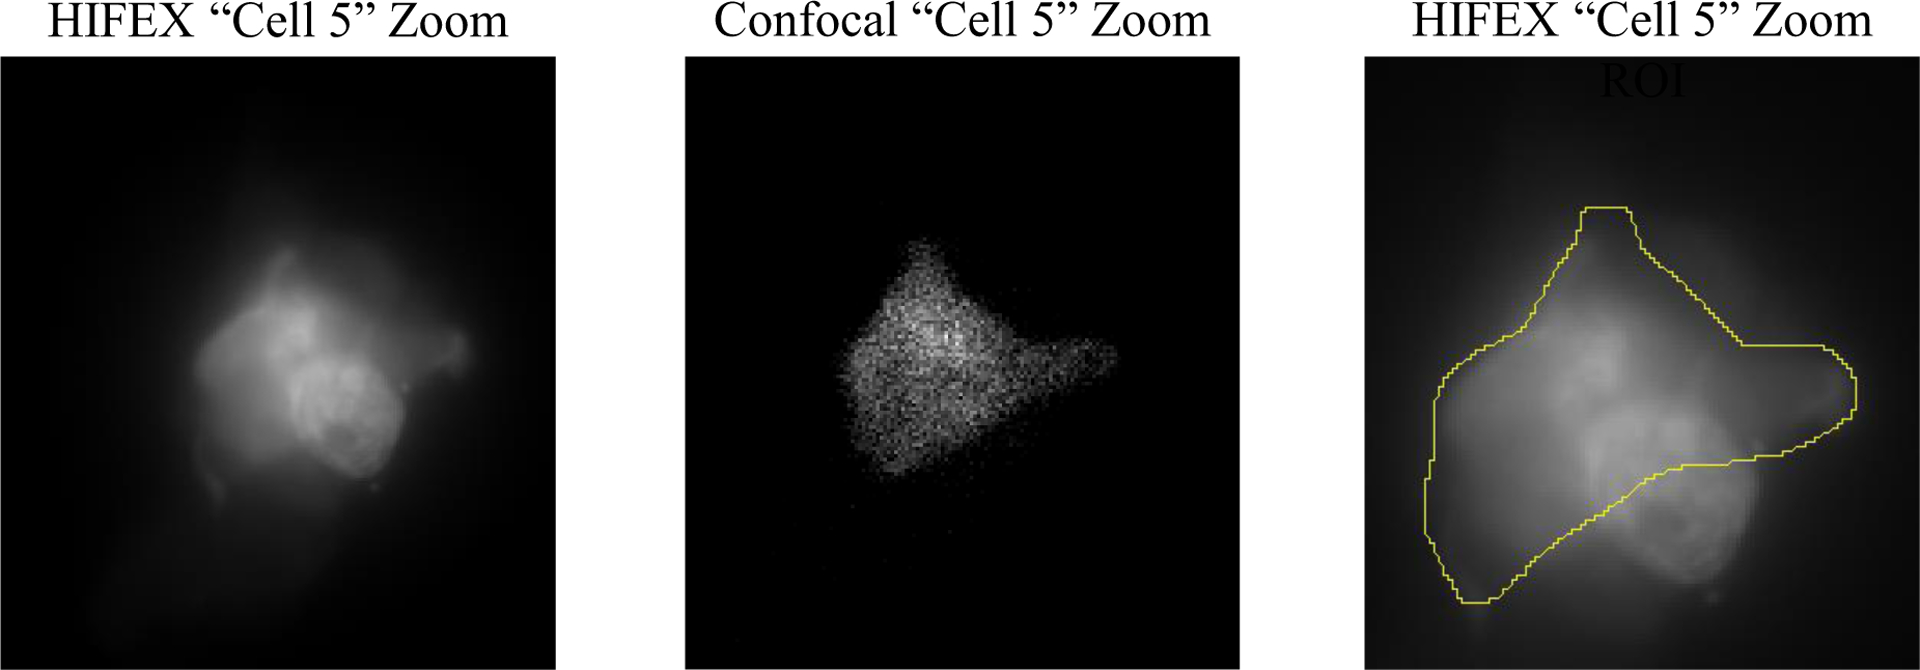
Förster resonance energy transfer (FRET) is a valuable tool for measuring molecular distances and the effects of biological processes such as cyclic nucleotide messenger signaling and protein localization. Most FRET techniques require two fluorescent proteins with overlapping excitation/emission spectral pairing to maximize detection sensitivity and FRET efficiency. FRET microscopy often utilizes differing peak intensities of the selected fluorophores measured through different optical filter sets to estimate the FRET index or efficiency. Microscopy platforms used to make these measurements include wide-field, laser scanning confocal, and fluorescence lifetime imaging. Each platform has associated advantages and disadvantages, such as speed, sensitivity, specificity, out-of-focus fluorescence, and Z-resolution. In this study, we report comparisons among multiple microscopy and spectral filtering platforms such as standard 2-filter FRET, emission-scanning hyperspectral imaging, and excitation-scanning hyperspectral imaging. Samples of human embryonic kidney (HEK293) cells were grown on laminin-coated 28 mm round gridded glass coverslips (10816, Ibidi, Fitchburg, Wisconsin) and transfected with adenovirus encoding a cAMP-sensing FRET probe composed of a FRET donor (Turquoise) and acceptor (Venus). Additionally, 3 FRET "controls" with fixed linker lengths between Turquoise and Venus proteins were used for inter-platform validation. Grid locations were logged, recorded with light micrographs, and used to ensure that whole-cell FRET was compared on a cell-by-cell basis among the different microscopy platforms. FRET efficiencies were also calculated and compared for each method. Preliminary results indicate that hyperspectral methods increase the signal-to-noise ratio compared to a standard 2-filter approach.
Keywords: FRET; Fluorescence; Hyperspectral; Microscopy; Signature; Spectral; Spectroscopy.
Figures


Similar articles
-
Assessing FRET using spectral techniques.Cytometry A. 2013 Oct;83(10):898-912. doi: 10.1002/cyto.a.22340. Epub 2013 Aug 8. Cytometry A. 2013. PMID: 23929684 Free PMC article.
-
Flow cytometric measurement of fluorescence (Förster) resonance energy transfer from cyan fluorescent protein to yellow fluorescent protein using single-laser excitation at 458 nm.Cytometry A. 2003 May;53(1):39-54. doi: 10.1002/cyto.a.10037. Cytometry A. 2003. PMID: 12701131
-
Spectral imaging of FRET-based sensors reveals sustained cAMP gradients in three spatial dimensions.Cytometry A. 2018 Oct;93(10):1029-1038. doi: 10.1002/cyto.a.23572. Epub 2018 Sep 3. Cytometry A. 2018. PMID: 30176184 Free PMC article.
-
Quantification of Förster resonance energy transfer by monitoring sensitized emission in living plant cells.Front Plant Sci. 2013 Oct 29;4:413. doi: 10.3389/fpls.2013.00413. Front Plant Sci. 2013. PMID: 24194740 Free PMC article. Review.
-
Protein localization in living cells and tissues using FRET and FLIM.Differentiation. 2003 Dec;71(9-10):528-41. doi: 10.1111/j.1432-0436.2003.07109007.x. Differentiation. 2003. PMID: 14686950 Review.
References
-
- Förster T, “Zwischenmolekulare energiewanderung und fluoreszenz,” Annalen der physik 437(1–2), 55–75 (1948).
-
- Clegg RM, “The history of FRET,” [Reviews in Fluorescence 2006], Springer, 1–45 (2006).
-
- Lakowicz JR, [Principles of fluorescence spectroscopy, 3rd ed.], Springer US; (2006).
Grants and funding
LinkOut - more resources
Full Text Sources