. 2021;106(2):1477-1489.
doi: 10.1007/s11071-021-06505-0. Epub 2021 May 21.

Synchronized nonpharmaceutical interventions for the control of COVID-19

Affiliations

Synchronized nonpharmaceutical interventions for the control of COVID-19

Bing Zhang et al. Nonlinear Dyn. 2021.

Abstract

The world is experiencing an ongoing pandemic of coronavirus disease-2019 (COVID-19), which is caused by severe acute respiratory syndrome coronavirus 2 (SARS-CoV-2). In attempts to control the pandemic, a range of nonpharmaceutical interventions (NPIs) has been implemented worldwide. However, the effect of synchronized NPIs for the control of COVID-19 at temporal and spatial scales has not been well studied. Therefore, a meta-population model that incorporates essential nonlinear processes was constructed to uncover the transmission characteristics of SARS-CoV-2 and then assess the effectiveness of synchronized NPIs on COVID-19 dynamics in China. Regional synchronization of NPIs was observed in China, and it was found that a combination of synchronized NPIs (the travel restrictions, the social distancing and the infection isolation) prevented 93.7% of SARS-CoV-2 infections. The use of synchronized NPIs at the time of the Wuhan lockdown may have prevented as much as 38% of SARS-CoV-2 infections, compared with the unsynchronized scenario. The interconnectivity of the epicenter, the implementation time of synchronized NPIs, and the number of regions considered all affected the performance of synchronized NPIs. The results highlight the importance of using synchronized NPIs in high-risk regions for the control of COVID-19 and shed light on effective strategies for future pandemic responses.

Supplementary information: The online version contains supplementary material available at 10.1007/s11071-021-06505-0.

Keywords: COVID-19; Infection isolation; Nonpharmaceutical interventions; Social distancing; Synchronization.


Conflict of interest statement

Conflict of interestThe authors declare no competing interests.

Figures

Fig. 1
Fig. 1
Dynamic pattern of coronavirus disease-2019 (COVID-19) cases in China from January 24 to February 12, 2020. a Histogram of time series of daily numbers of new COVID-19 cases in Hubei Province, China (blue and red represent regions outside and inside Wuhan, respectively). b Heatmap of the daily numbers of COVID-19 cases outside Hubei Province
Fig. 2
Fig. 2
Model structure of the meta-population Susceptible–Exposed–Infected (untraceable)–Infected (quarantined)–Infected (escaped quarantine)–Recovered model. The population in each region was divided into six compartments: susceptible individuals (S), exposed individuals (E), infected individuals that cannot be traced (IU; silent transmitters), infected individuals who are quarantined (isolated; IQ), infected individuals that escape quarantine (IH), and recovered individuals (R). Regional dynamics were then coupled with population movements. The key model parameters are listed in Table 1
Fig. 3
Fig. 3
Estimations of the growth coefficient (left) and strength (right) of infection isolation at provincial (a) and city levels (b). Only provinces with greater than 300 accumulated cases and cities with greater than 200 accumulated cases were selected. The median value for the growth coefficient and its 95% confidence intervals are depicted in the left panel. The heatmap in the right panel represents the projected strength of infection isolation for each target region
Fig. 4
Fig. 4
Effects of synchronized nonpharmaceutical interventions (NPIs) on the coronavirus disease-2019 pandemic in China in different scenarios. Four scenarios were tested with two strengths of infection isolation (low and high): no social distancing and no travel restriction measures (red), travel restriction measures only (gray), social distancing measures only (cyan), and social distancing and travel restriction measures (black). Simulations were run based on the national meta-population model. All of the NPIs were implemented after the Wuhan lockdown (dashed line). High-strength infection isolation after the Wuhan lockdown (triangle) was represented by growth coefficients of 0.25 and 0.53 for Wuhan and other regions, respectively (Table 1). Low-strength infection isolation (circle) after the Wuhan lockdown was represented by no change in the strength of infection isolation, which remained at 0.01 and 0.27 in Wuhan and other regions, respectively (Fig. S6)
Fig. 5
Fig. 5
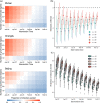
Effect of synchronized nonpharmaceutical interventions (NPIs) on the control of coronavirus disease-2019 (COVID-19) in China. a Effect of synchronized NPIs with the hypothetical epicenter located in Wuhan (medium interconnectivity), Chengdu (low interconnectivity), and Beijing (high interconnectivity). Interconnectivity was defined as the scaled degree-centrality score in the weighted network, with nodes as cities and edges representing population movement between cities. The effect of synchronized NPIs was measured as the proportion of infections that were averted compared to the unsynchronized situation (see Materials and Methods for more details). Model simulations were performed with different intervention times (from January 23 to February 12, with an interval of 2 days) and different spatial coverages (the number of coordinated cities ranged from 10 to 50, with an interval of 10) from January 16 to March 31. Parameters from the Hubei model were used for the initial states of an epicenter and the 16 cities with which it was most connected. In other regions, it was assumed there were no infections on January 16. b Relationship between the effect of synchronized NPIs and the interconnectivity of a hypothetical epicenter. The y-axis shows the estimated coefficient of the linear regression between the effect of synchronized NPIs and the city interconnectivity of the selected epicenter. c Effect of synchronized NPIs with different intervention times. The color boxplot represents various spatial coverages of the synchronized NPIs. The hypothetical epicenter in each simulation is one of 31 capital cities in China

References

    1. Zhu N, Zhang D, Wang W, Li X, Yang B, Song J, et al. A novel coronavirus from patients with pneumonia in China, 2019. N Engl J Med. 2020;382:727–733. doi: 10.1056/NEJMoa2001017. - DOI - PMC - PubMed
    1. Han, C., Li, M., Haihambo, N., Babuna, P., Liu, Q., Zhao, X., et al.: Mechanisms of recurrent outbreak of COVID-19: a model-based study. Nonlinear Dyn. (2021). 10.1007/s11071-021-06371-w - PMC - PubMed
    1. Lai S, Ruktanonchai NW, Zhou L, Prosper O, Luo W, Floyd JR, et al. Effect of non-pharmaceutical interventions to contain COVID-19 in China. Nature. 2020;585:410–413. doi: 10.1038/s41586-020-2293-x. - DOI - PMC - PubMed
    1. Maier BF, Brockmann D. Effective containment explains subexponential growth in recent confirmed COVID-19 cases in China. Science. 2020;368:742–746. doi: 10.1126/science.abb4557. - DOI - PMC - PubMed
    1. Wu K, Darcet D, Wang Q, Sornette D. Generalized logistic growth modeling of the COVID-19 outbreak: comparing the dynamics in the 29 provinces in China and in the rest of the world. Nonlinear Dyn. 2020;101:1561–1581. doi: 10.1007/s11071-020-05862-6. - DOI - PMC - PubMed

LinkOut - more resources