. 2021 May 17;19(2):15593258211009337.
doi: 10.1177/15593258211009337. eCollection 2021 Apr-Jun.

Analysis of Indoor Radon Data Using Bayesian, Random Binning, and Maximum Entropy Methods

Affiliations

Analysis of Indoor Radon Data Using Bayesian, Random Binning, and Maximum Entropy Methods

Maciej Pylak et al. Dose Response. .

Abstract

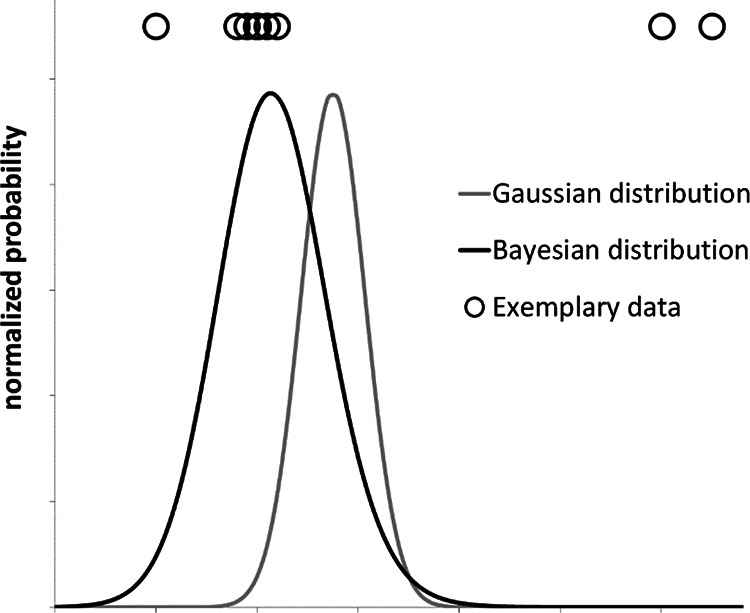
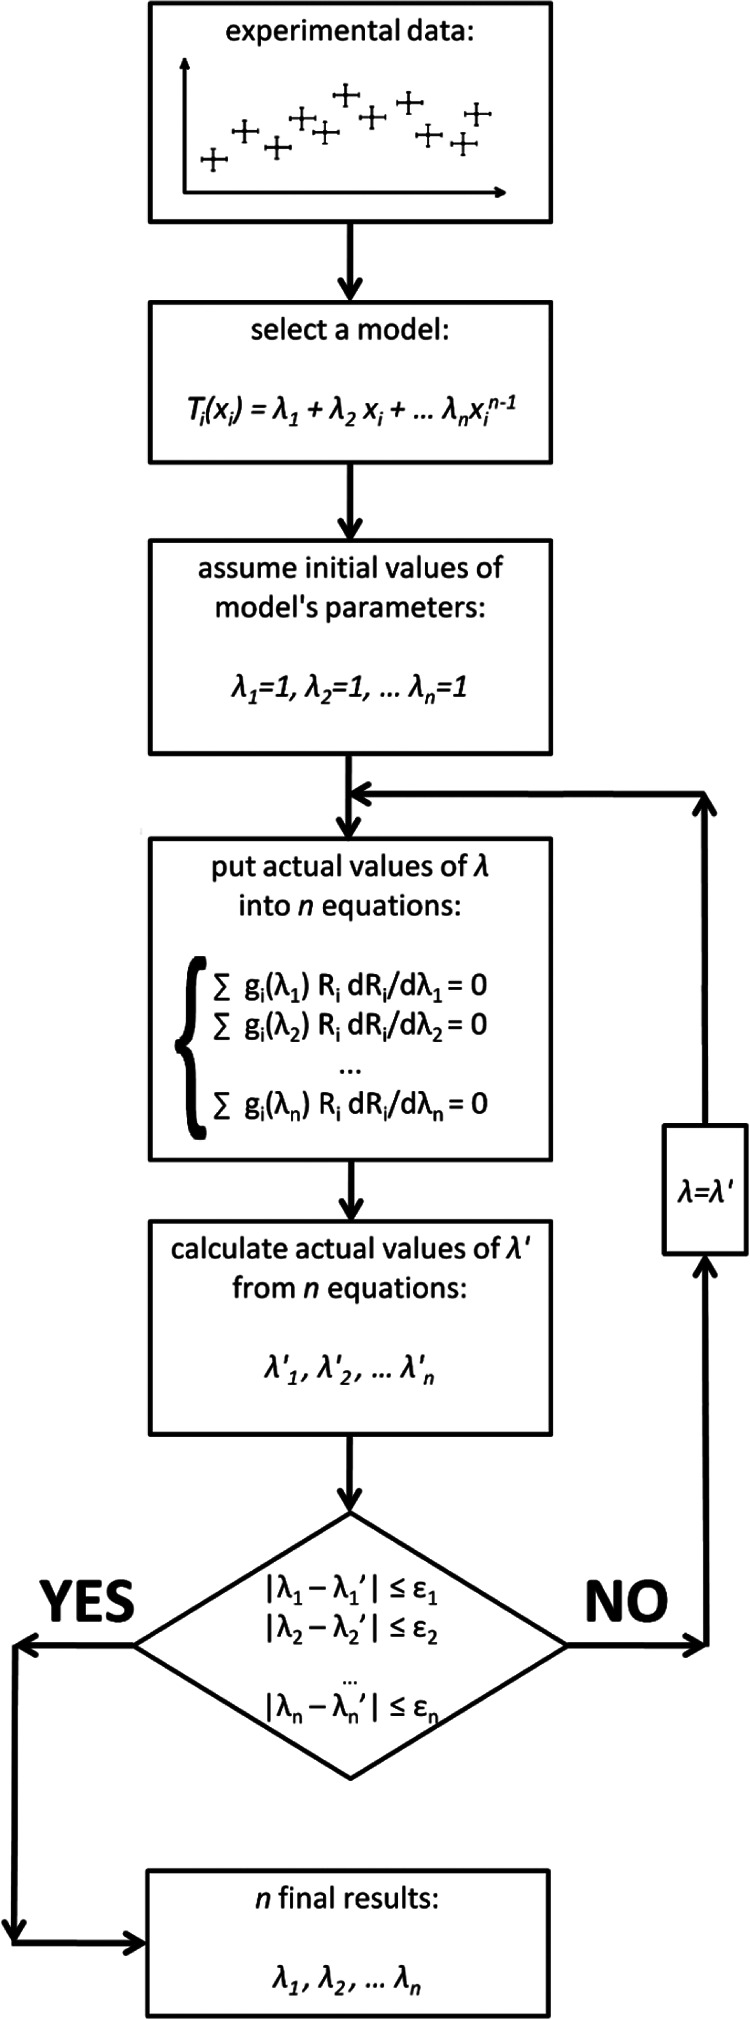
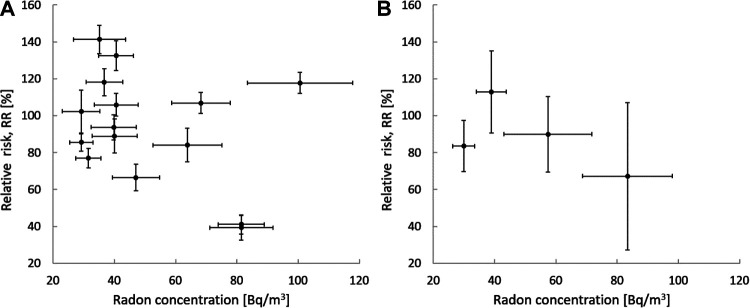
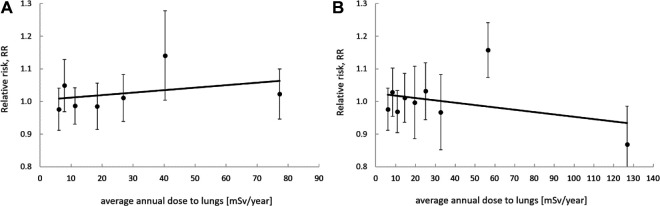
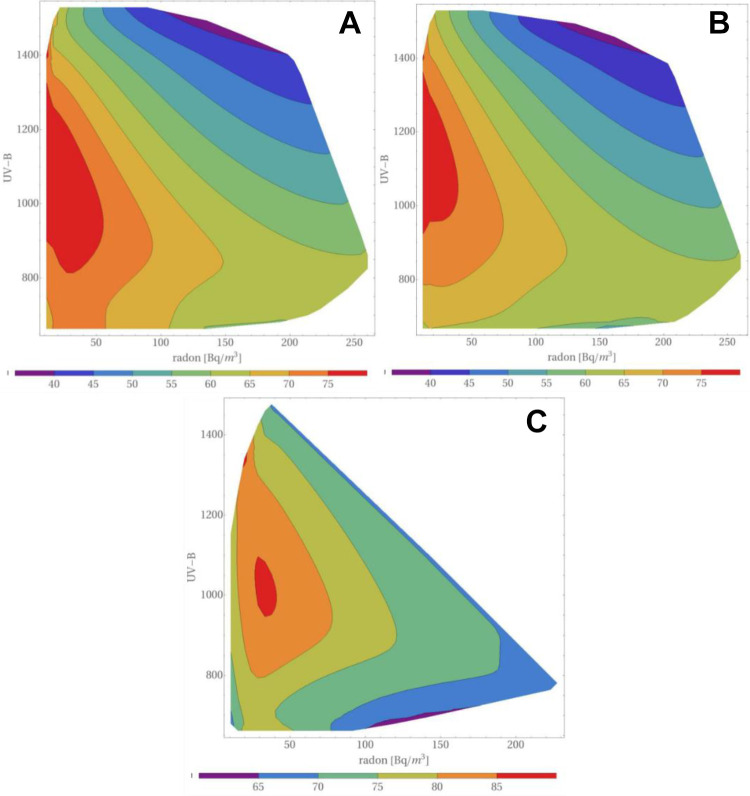
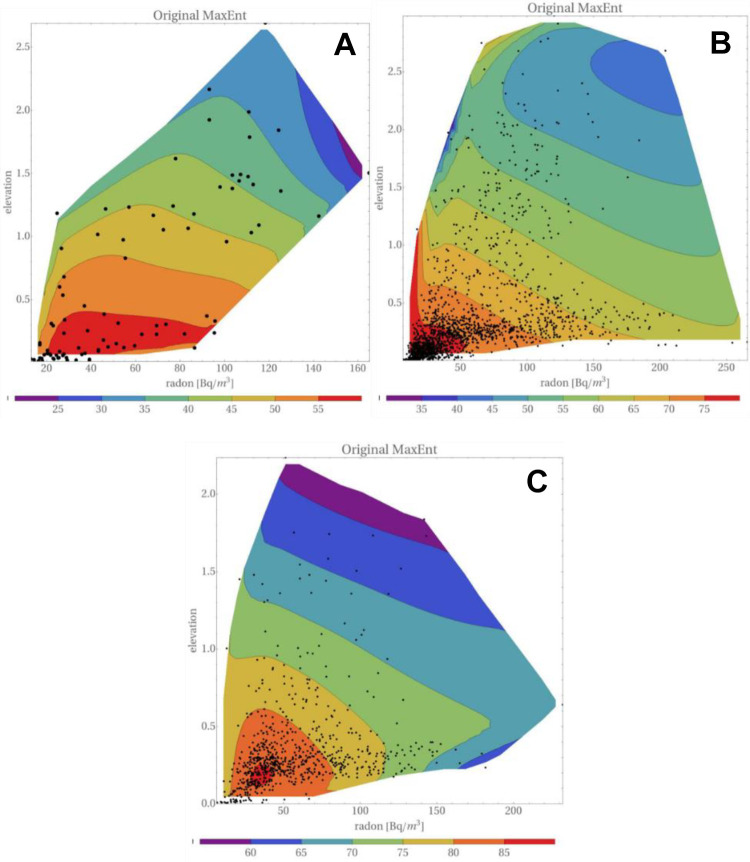
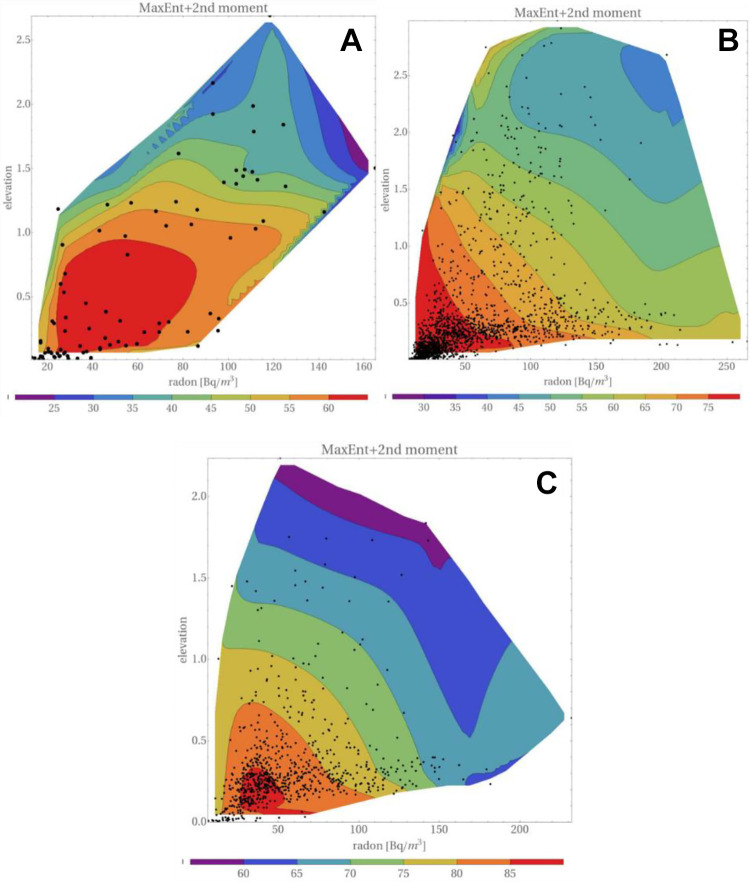
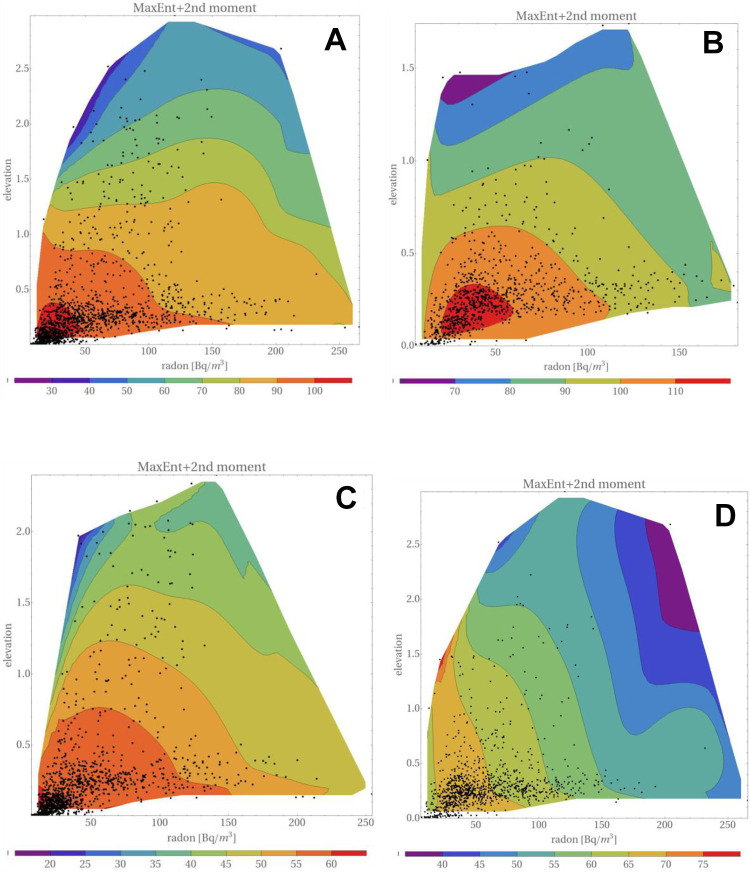
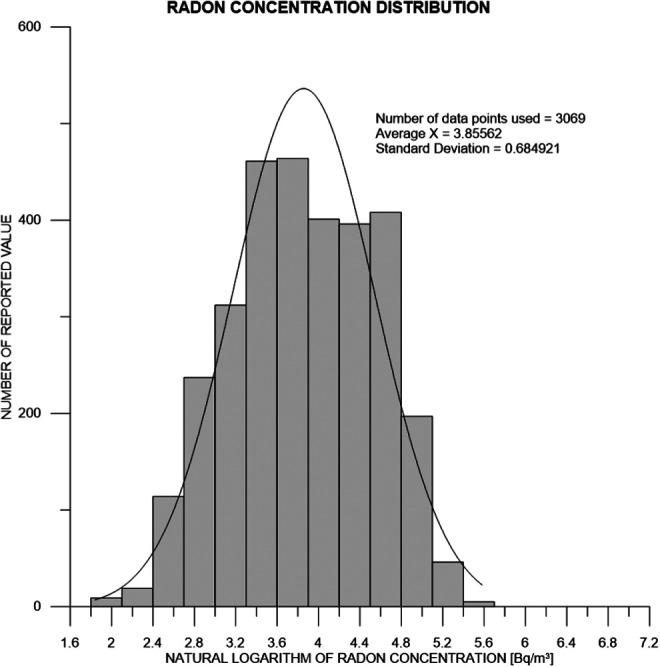
Three statistical methods: Bayesian, randomized data binning and Maximum Entropy Method (MEM) are described and applied in the analysis of US radon data taken from the US registry. Two confounding factors-elevation of inhabited dwellings, and UVB (ultra-violet B) radiation exposure-were considered to be most correlated with the frequency of lung cancer occurrence. MEM was found to be particularly useful in extracting meaningful results from epidemiology data containing such confounding factors. In model testing, MEM proved to be more effective than the least-squares method (even via Bayesian analysis) or multi-parameter analysis, routinely applied in epidemiology. Our analysis of the available residential radon epidemiology data consistently demonstrates that the relative number of lung cancers decreases with increasing radon concentrations up to about 200 Bq/m3, also decreasing with increasing altitude at which inhabitants live. Correlation between UVB intensity and lung cancer has also been demonstrated.

Keywords: Bayesian; Maximum Entropy Method; Monte Carlo; radon analysis; radon risk; risk analysis.


Conflict of interest statement

Declaration of Conflicting Interests: The author(s) declared no potential conflicts of interest with respect to the research, authorship, and/or publication of this article.

Figures

Figure 1.
Figure 1.
Comparison between a robust Bayesian probability distribution (Eq. (7)) and a classical Gaussian distribution for a given exemplary set of experimental data points (shown above the plotted distributions). This purely qualitative example shows that the robust Bayesian regression method suppresses apparent outliers, while the Gaussian distribution assigns equal significance to all data points.
Figure 2.
Figure 2.
Numerical algorithm of robust Bayesian regression analysis. The parameter ε should be as low as possible, however, in practice it suffices that ε is approximately one order of magnitude smaller than the significance of λ.
Figure 3.
Figure 3.
Ecological data on the relative risk [%] of lung and bronchus cancers, versus low concentrations [Bq/m3] of radon in Poland: (A) original data, (B) data merged to 4 points after arbitrarily selected binning (bin ranges: 0-33, 33-45, 45-70 and above 70 Bq/m3). The slopes, a, of the linear (1+ax) fits are (−0.177 ± 0.134) [Bq 1 m3] and (−0.260 ± 0.141) [Bq 1 m3] for plots (A) and (B), respectively. All uncertainties (both vertical and horizontal) represent one standard deviation.
Figure 4.
Figure 4.
A re-analysis of 32 case-control data points listed by Dobrzyński et al, excluding ecological data, after merging groups of experimental points into single values within bins under arbitrarily defined boundaries: (A) bin ranges (Bq/m3): 0-37, 37-50, 50-75, 75-125, 125-175, 175-270 and 270-800, resulting in a positive slope fit (“pro-LNT” conclusion); (B) bin ranges (Bq/m3) 0-37, 37-53.5, 53.5-65, 65-100, 100-124, 124-150.1, 150.1-200, 200-600 and 600-800, resulting in a negative slope fit (“pro-hormetic” conclusion). In both cases, the same input data were used.
Figure 5.
Figure 5.
Algorithm of the random binning procedure which delivers a histogram of fitted parameters and their distribution.
Figure 6.
Figure 6.
Histogram of slope values of linear fits (RR = 1 + a·D) to data of the 34-study meta-analysis by Dobrzyński et al. 100,000 Monte Carlo iterations of randomly selected binning (cf. Figure 5) were performed.
Figure 7.
Figure 7.
Histogram of slope values of linear fits (RR = 100% + a·D) to data of the ecological Polish study, cf. Figure 3A. 2000 Monte Carlo iterations of randomly selected binning (cf. Figure 5) were performed.
Figure 8.
Figure 8.
Maps of lung cancer morbidity versus UVB level (in kJ/m3): (A) radon concentration plane for the whole analyzed population, (B) medium smoking prevalence, (C) high smoking prevalence. All altitudes have been taken into account. The color bar below every figure shows the morbidity of lung cancer per 100,000 inhabitants. The Maximum Entropy Method with its Eq. (19) was used.
Figure 9.
Figure 9.
Distribution of lung cancers, versus elevation and radon concentration, for men and women taken together. (A) Low smoking prevalence, (B) medium smoking prevalence, and (C) high smoking prevalence. Dots in these plots represent the positions of points, as given in the catalog of Simeonov and Himmelstein. Elevation is in kilometers. “Original MaxEnt” represents Eq. (19).
Figure 10.
Figure 10.
Distribution of lung cancers, versus elevation and radon concentration with uncertainties taken into account and (▵x, ▵y) = (5.0, 0.06). The order and description of maps is the same as that in Figure 9. The only difference is in the use of Eq. (21) in the reconstruction.
Figure 11.
Figure 11.
Distribution of lung cancers versus elevation and radon concentration for men in regions with medium (A) and high (B) smoking prevalence. (C) and (D) Show distributions for women, using the same convention as that for men. Elevation is in kilometers.
Figure 12.
Figure 12.
Log-normal distribution of radon concentration at any altitude. The fitted Gaussian shows that the median concentration of naturally occurring radon is 47.3 Bq/m3 within 68% CI (23.8-93.7 Bq/m3) and 95% CI (12.0-185.9 Bq/m3).

Similar articles

Cited by

References

    1. Council Directive 2013/59/Euratom of 5 December 2013. Laying down basic safety standards for protection against the dangers arising from exposure to ionising radiation. Published 2013. Accessed March 1, 2021. https://eur-lex.europa.eu/eli/dir/2013/59/oj
    1. Vogeltanz-Holm N, Schwartz GG. Radon and lung cancer: what does the public really know? J Environ Radioact. 2018;192:26–31. - PubMed
    1. Darby S, Hill D, Auvinen A, et al. Radon in homes and risk of lung cancer: collaborative analysis of individual data from 13 European case-control studies. BMJ. 2005;330(7485):223–226. - PMC - PubMed
    1. Rodríguez-Martínez Á, Torres-Durán M, Barros-Dios JM, Ruano-Ravina A. Residential radon and small cell lung cancer. A systematic review. Cancer Lett. 2018;426:57–62. doi:10.1016/j.canlet.2018.04.003 - PubMed
    1. Dempsey S, Lyons S, Nolan A. High radon areas and lung cancer prevalence: evidence from Ireland. J Environ Radioact. 2018;182:12–19. - PubMed

LinkOut - more resources