

EEG power spectral density in locked-in and completely locked-in state patients: a longitudinal study
- PMID: 34035865
- PMCID: PMC8131474
- DOI: 10.1007/s11571-020-09639-w
EEG power spectral density in locked-in and completely locked-in state patients: a longitudinal study
Abstract
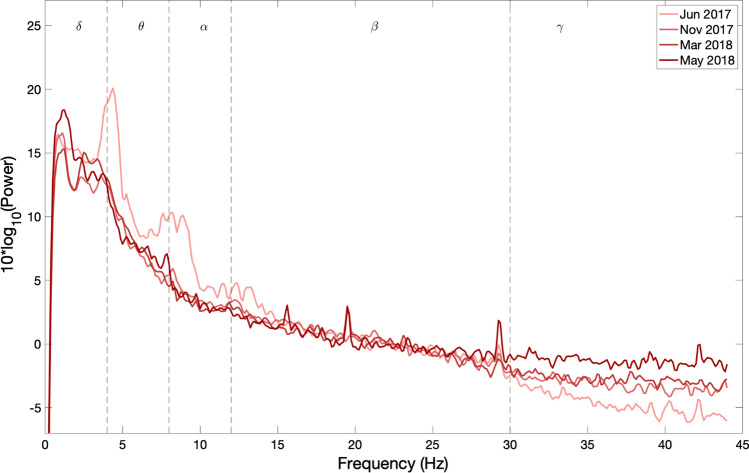
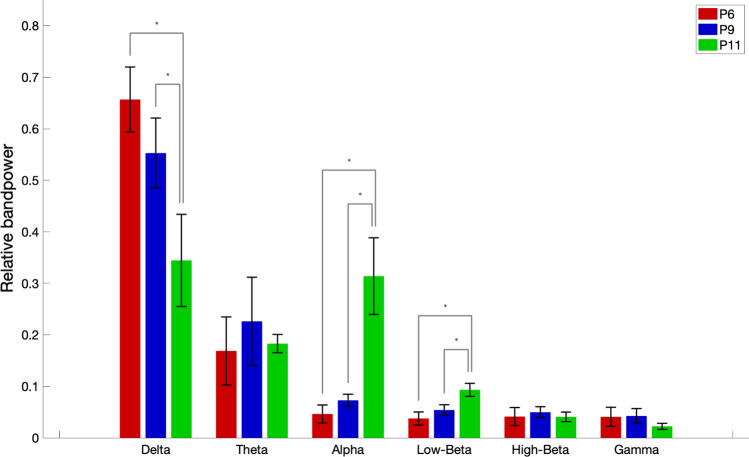
Persons with their eye closed and without any means of communication is said to be in a completely locked-in state (CLIS) while when they could still open their eyes actively or passively and have some means of communication are said to be in locked-in state (LIS). Two patients in CLIS without any means of communication, and one patient in the transition from LIS to CLIS with means of communication, who have Amyotrophic Lateral Sclerosis were followed at a regular interval for more than 1 year. During each visit, resting-state EEG was recorded before the brain-computer interface (BCI) based communication sessions. The resting-state EEG of the patients was analyzed to elucidate the evolution of their EEG spectrum over time with the disease's progression to provide future BCI-research with the relevant information to classify changes in EEG evolution. Comparison of power spectral density (PSD) of these patients revealed a significant difference in the PSD's of patients in CLIS without any means of communication and the patient in the transition from LIS to CLIS with means of communication. The EEG of patients without any means of communication is devoid of alpha, beta, and higher frequencies than the patient in transition who still had means of communication. The results show that the change in the EEG frequency spectrum may serve as an indicator of the communication ability of such patients.
Keywords: Alpha frequency; Completely locked-in state (CLIS); LIS (locked-in state); Power spectrum density (PSD); Resting-state electroencephalogram (EEG).
© The Author(s) 2020.
Conflict of interest statement
Conflict of interestThe authors declare that they have no conflict of interest.
Figures


References
-
- Babiloni C, Pistoia F, Sarà M, Vecchio F, Buffo P, Conson M, Onorati P, Albertini G, Rossini PM. Resting state eyes-closed cortical rhythms in patients with locked-in-syndrome: an EEG study. Clin Neurophysiol. 2010;121:1816–1824. - PubMed
-
- Bauer G, Gerstenbrand F, Rumpl E. Varieties of the locked-in syndrome. J Neurol. 1979;221:77–91. - PubMed
-
- Belouchrani A, Abed-Meraim K, Cardoso JF, Moulines E. A blind source separation technique using second-order statistics. IEEE Trans Signal Process. 1997;45(2):434–444.
-
- Benjamini Y, Hochberg Y. Controlling the false discovery rate: a practical and powerful approach to multiple testing. J R Stat Soc Ser B (Methodol) 1995;57(1):289–300.
-
- Birbaumer N. Breaking the silence: brain–computer interfaces (BCI) for communication and motor control. Psychophysiology. 2006;43(6):517–532. - PubMed
LinkOut - more resources
Full Text Sources
