. 2021 Mar 31;8(3):201197.
doi: 10.1098/rsos.201197.

Predicting potential future reduction in shark bites on people

Affiliations

Predicting potential future reduction in shark bites on people

Corey J A Bradshaw et al. R Soc Open Sci. .

Abstract

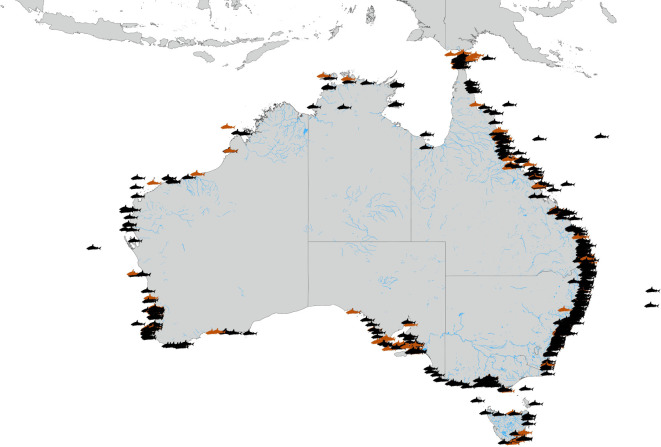
Despite the low chance of a person being bitten by a shark, there are serious associated costs. Electronic deterrents are currently the only types of personal deterrent with empirical evidence of a substantial reduction in the probability of being bitten by a shark. We aimed to predict the number of people who could potentially avoid being bitten by sharks in Australia if they wear personal electronic deterrents. We used the Australian Shark Attack File from 1900 to 2020 to develop sinusoidal time-series models of per capita incidents, and then stochastically projected these to 2066. We predicted that up to 1063 people (range: 185-2118) could potentially avoid being bitten across Australia by 2066 if all people used the devices. Avoiding death and injury of people over the next half-century is of course highly desirable, especially when considering the additional costs associated with the loss of recreational, commercial and tourism revenue potentially in the tens to hundreds of millions of dollars following clusters of shark-bite events.

Keywords: bull shark; shark attack; shark–human interactions; tiger shark; white shark.


Figures

Figure 1.
Figure 1.
Spatial distribution of shark-bite incidents in the Australian Shark Attack File. Red icons show incidents resulting in a human fatality.
Figure 2.
Figure 2.
Wavelet correspondence between the patterns of multidecadal periodicity in the ENSO (southern oscillation index) and the scaled bites person−1 year−1 series for (a) Australia combined (AUS), (b) New South Wales (NSW), (c) Queensland (QLD) and (d) Western Australia (WA). The wavelets are computed based on a 5-year running mean of the yearly averaged southern-oscillation index to remove the finer scale periodicity.
Figure 3.
Figure 3.
Observed scaled bites person−1 year−1 (black lines) for (a) Australia combined (AUS), (b) New South Wales (NSW), (c) Queensland (QLD) and (d) Western Australia (WA). Shown also are the top-ranked modelled fits for the observed series (darker black lines) for each region (table 1). In the (a) for Australia, the top-ranked model was the cubic fit (darkest black line), followed by the quadratic (QUAD), and linear (LIN). The yearly averaged southern oscillation index (SOI) is shown in grey (right y-axis) with its top-ranked cubic fit (darker grey line). Future (red) sinusoidal fits are shown for 2020–2066, including the median (widest red line) and upper and lower 95% confidence limits (medium-width red lines), and an example iteration sampling from the observed residuals (light red line) for each region.
Figure 4.
Figure 4.
Number of fewer bites year−1 predicted for (a) Australia combined (AUS), (b) New South Wales (NSW), (c) Queensland (QLD), and (d) Western Australia (WA) for incrementing proportions of people wearing electronic deterrents from 2020 to 2066.
Figure 5.
Figure 5.
Three-dimensional representation of the number of people avoiding shark bites from 2020 to 2066 for incrementing proportions of people wearing electronic deterrents for Australia combined. Shown is the median (darker surface) and the upper and lower 95% confidence limits (lighter surfaces).

References

    1. McPhee D. 2014. Unprovoked shark bites: are they becoming more prevalent? Coastal Manage. 42, 478-492. (10.1080/08920753.2014.942046) - DOI
    1. Ferretti F, Jorgensen S, Chapple TK, De Leo G, Micheli F.. 2015. Reconciling predator conservation with public safety. Front. Ecol. Environ. 13, 412-417. (10.1890/150109) - DOI
    1. Ryan LA, Lynch SK, Harcourt R, Slip DJ, Peddemors V, Everett JD, Harrison LM, Hart NS. 2019. Environmental predictive models for shark attacks in Australian waters. Mar. Ecol. Prog. Ser. 631, 165-179. (10.3354/meps13138) - DOI
    1. Midway SR, Wagner T, Burgess GH. 2019. Trends in global shark attacks. PLoS ONE 14, e0211049. (10.1371/journal.pone.0211049) - DOI - PMC - PubMed
    1. Muter BA, Gore ML, Gledhill KS, Lamont C, Huveneers C. 2013. Australian and U.S. news media portrayal of sharks and their conservation. Conserv. Biol. 27, 187-196. (10.1111/j.1523-1739.2012.01952.x) - DOI - PubMed

LinkOut - more resources