

COVID-19 outbreak in Italy: estimation of reproduction numbers over 2 months prior to phase 2
- PMID: 34036037
- PMCID: PMC8137269
- DOI: 10.1007/s10389-021-01567-1
COVID-19 outbreak in Italy: estimation of reproduction numbers over 2 months prior to phase 2
Abstract
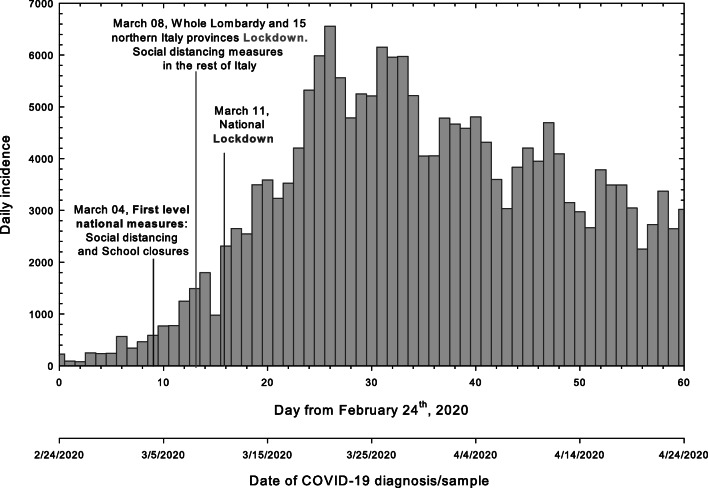
Purpose: Two months after its first COVID-19 case, Italy counted more than 190,000 confirmed positive cases. From the beginning of April 2020, the nationwide lockdown started to show early effects by reducing the total cumulative incidence reached by the epidemic wave. Here we provide the reproduction number estimation both in space and in time from February 24 to April 24, 2020 over 2 months into the epidemic.
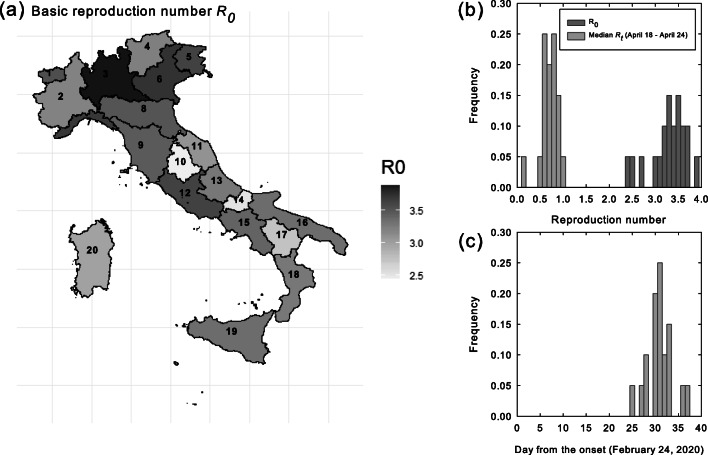
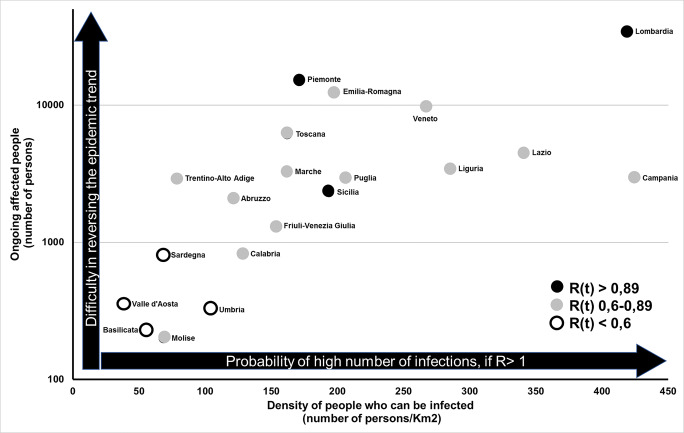
Methods: The aim of the present work was to provide a systematical mapping of the SARS-CoV-2 transmission dynamics spread to all regions of Italy. To do so, we estimated the basic reproduction number (R 0 ), by using the maximum likelihood estimation method in the early stage of the epidemic. In addition, we determined time evolution of this parameter across the 2 months of the observational period. Finally, we linked R t , with two indices, the first representing the number of contagious people and the latter the density of susceptibiltiy to infection of people in a region as recorded on April 24, 2020.
Results: Our estimates suggest a basic reproduction number averaged over all the regions of 3.29. Based on the SARS-CoV-2 transmission dynamics reported here, we gave a quantitative evaluation of the efficiency of the government measures to lower the reproduction number below 1 (control regime). We estimated that the worst-hit regions in Italy reached the control regime level (R t < 1) in about a month.
Conclusion: Our work was carried out in the period between April and July,2020. We found that the mean value of time to reach the control regime across the whole country was about 31 days from February 24, 2020. Moreover, we highlighted the interplay between the reproduction number and two epidemiological/demographic indices to evaluate the "state of activity" of the epidemic, potentially helping in challenging decisions to continue, ease, or tighten restrictions.
Supplementary information: The online version contains supplementary material available at 10.1007/s10389-021-01567-1.
Keywords: Covid-19; Reproduction number; SARS-CoV-2; Time-dependent epidemiology; Transmission dynamics.
© The Author(s), under exclusive licence to Springer-Verlag GmbH Germany, part of Springer Nature 2021.
Conflict of interest statement
Conflict of interestThe authors declared that they have no conflict of interest.
Figures
References
-
- Carinci F (2020) Covid-19: preparedness, decentralisation, and the hunt for patient zero. BMJ 368:bmj.m799. 10.1136/bmj.m799 - PubMed
LinkOut - more resources
Full Text Sources
Other Literature Sources
Miscellaneous