. 2021 May 7:2021:9958745.
doi: 10.1155/2021/9958745. eCollection 2021.

The Potential Genes Mediate the Pathogenicity of Allogeneic CD4+T Cell in aGVHD Mouse Model

Affiliations

The Potential Genes Mediate the Pathogenicity of Allogeneic CD4+T Cell in aGVHD Mouse Model

Zhengyu Yu et al. Biomed Res Int. .

Abstract

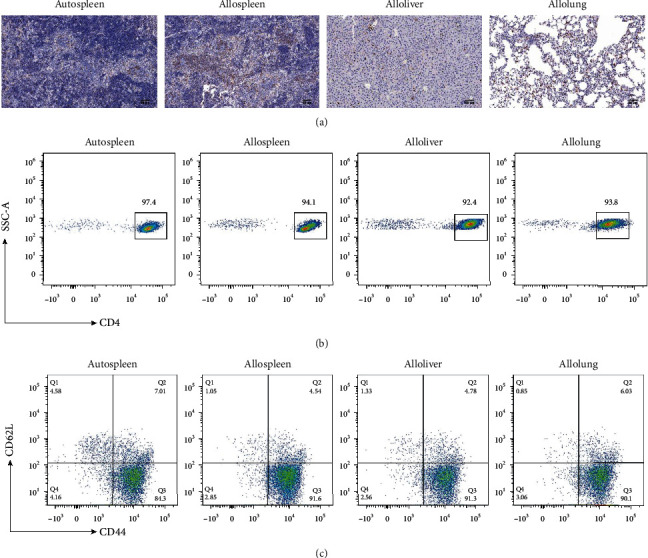
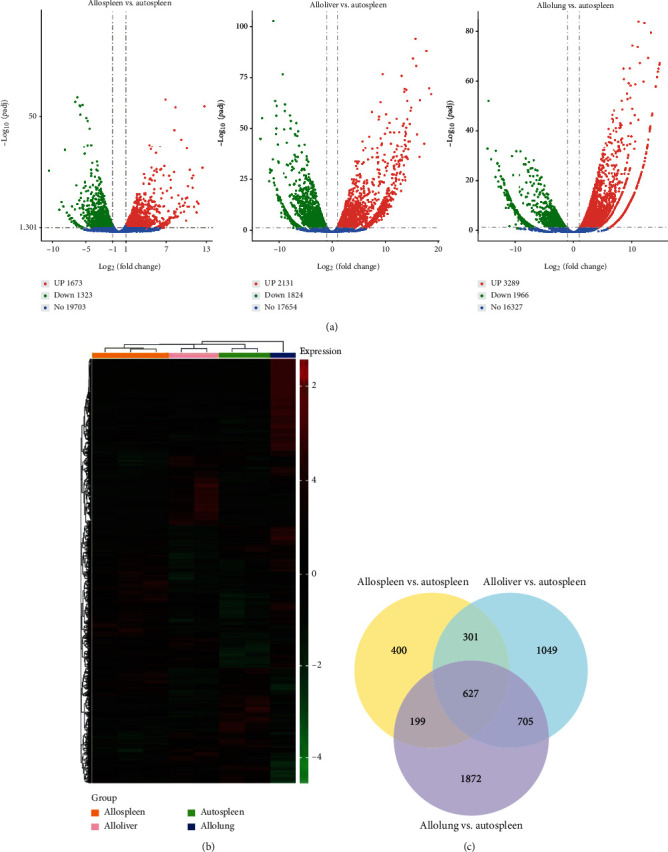
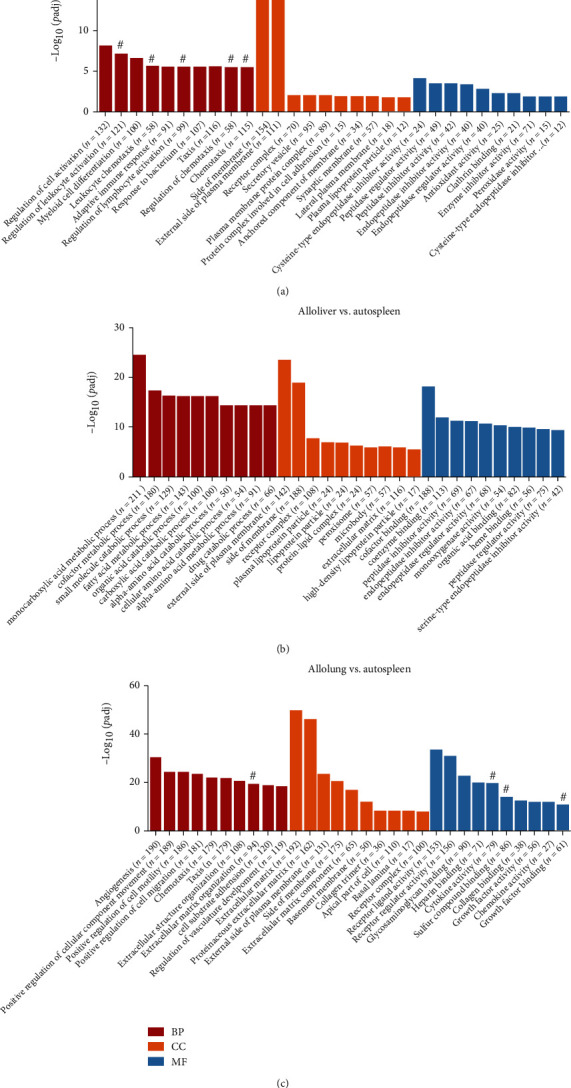
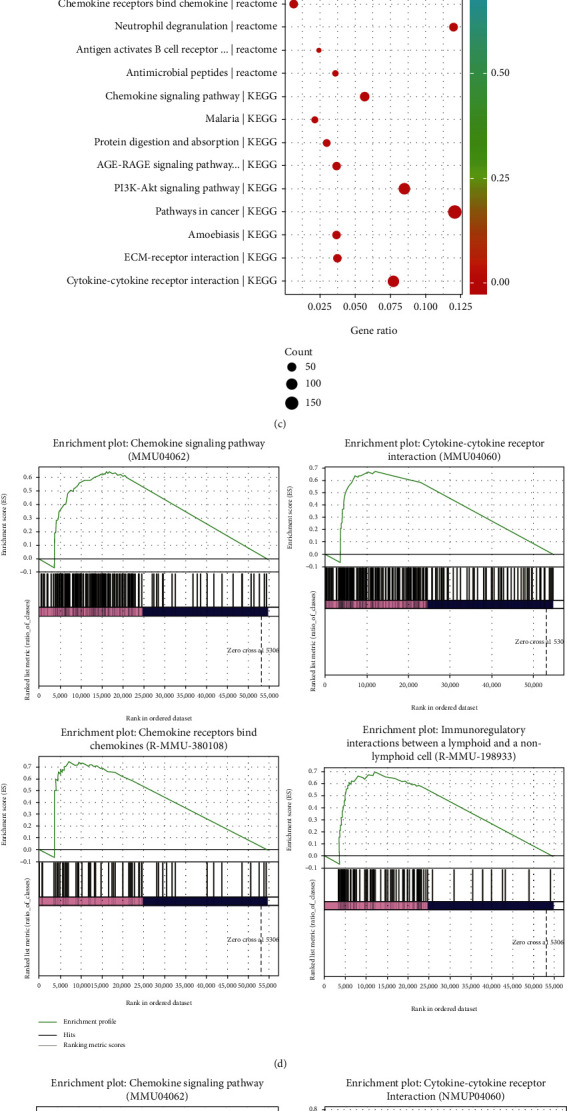
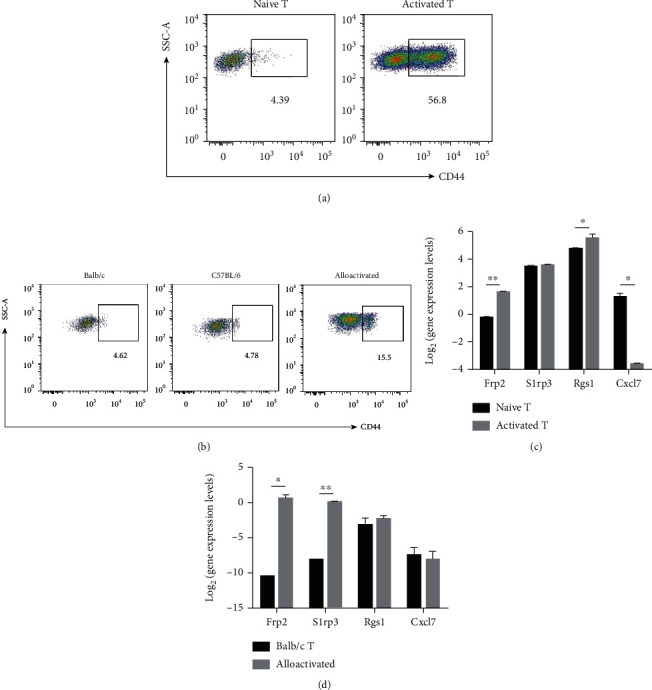
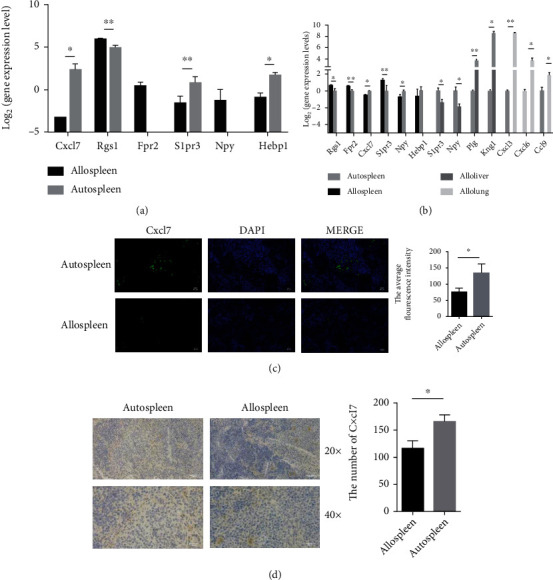
Acute graft-versus-host disease (aGVHD) remains a significant and severe complication of allogeneic hematopoietic stem cell transplantation (allo-HSCT). Due to the occurrence of aGVHD, allo-HSCT significantly increases the mortality rate compared with autologous hematopoietic stem cell transplantation (auto-HSCT). In this study, auto-HSCT and allo-HSCT aGVHD mouse models were built to detect the difference in CD4+ lymphocyte in different tissues based on ribonucleic acid sequencing (RNA-Seq) analysis. Clustering analysis, functional annotation, and pathway enrichment analysis were performed on differentially expressed genes (DEGs). The protein-protein interaction (PPI) network was used to find hub genes. CD4+T cells were activated by MLR and cytokine stimulation. Cells were sorted out by a flow cell sorter. The selected genes were verified by qRT-PCR, histology, and immunofluorescence staining. The GSE126518 GEO dataset was used to verify the hub genes. Enrichment analysis revealed four immune-related pathways that play an important role in aGVHD, including immunoregulatory interactions between a lymphoid and a nonlymphoid cell, chemokine receptors binding chemokines, cytokine and cytokine receptor interaction, and the chemokine signaling pathway. At the same time, with the PPI network, 11 novel hub genes that were most likely to participate in immunoregulation in aGVHD were identified, which were further validated by qRT-PCR and the GSE126518 dataset. Besides, the protein expression level of Cxcl7 was consistent with the sequencing results. In summary, this study revealed that immunoregulation-related DEGs and pathways played a vital role in the onset of aGVHD. These findings may provide some new clues for probing the pathogenesis and treatment of aGVHD.


Conflict of interest statement

The authors declare that they have no competing interests.

Figures

Figure 1
Figure 1
The ratio of the effector CD4+T cells. (a) The organs stained with antibodies of CD4. (b) Percent of CD4+T cells in autospleen, allospleen, alloliver, and allolung. (c) Percent of the effector CD4+T cells (CD4+CD44+CD62Llow) in autospleen, allospleen, alloliver, and allolung. The effector CD4+T cells (CD4+CD44+CD62Llow) were detected by flow cytometry.
Figure 2
Figure 2
The DEGs among the spleen, liver, and lung in auto-HSCT and allo-HSCT aGVHD mouse models. (a) Volcano map of DEGs. Log2(fold change > 1) and padj < 0.05 were considered significant. (b) The heat map of DEGs. Each column represents a sample, each row represents a gene, and different expression multiples are represented by different colors. The red blocks are for high expression genes, while the green blocks are for low expression genes. (c) Venn of DEGs. DEGs: differentially expressed genes.
Figure 3
Figure 3
Enriched Gene Ontology (GO) terms. (a) The top 10 biological process (BP), cellular component (CC), and molecular function (MF) terms between allospleen and autospleen. (b) The top 10 BP, CC, and MF terms between alloliver and autospleen. (c) The top 10 BP, CC, and MF terms between allolung and autospleen. # for GO terms associated with immunoregulation.
Figure 4
Figure 4
Enriched Kyoto Encyclopedia of Genes and Genomes (KEGG) and Reactome pathway terms. The top 10 KEGG and Reactome terms between allospleen and autospleen (a), alloliver and autospleen (b), and allolung and autospleen (c). The immune-related KEGG and Reactome pathways were analyzed using GSEA assays between allospleen and autospleen (d), alloliver and autospleen (e), and allolung and autospleen (f). The size of the dots represents the number of enrichment genes in the pathway. The different colors of the dots indicate the different p values.
Figure 5
Figure 5
The verification of the expression of hub genes in vitro. (a) The percent of activated CD4+T cells in naive and activated T cells by induction of anti-CD3/CD28 antibodies. (b) The percent of the activated CD4+T cells in Balb/c, C57BL/6, and alloactivated T cells after MLR. The activated CD4+T cells (CD4+CD44+) were detected by flow cytometry analysis. (c) The expression levels of genes from activated T cells were detected. (d) The expression levels of genes from FACS-sorted activated CD4+T cells were detected. The y-axis is the log2 scale of the expression level of hub genes. Each experiment was performed at least three times, and the results were presented as mean ± SD.
Figure 6
Figure 6
The verification of the expression of hub genes in vivo. (a) The hub genes from allospleen and autospleen were verified in GSE126518. (b) The hub genes were verified from different tissues by qRT-PCR. CXCL7 deposition was detected in target areas of the spleen in aGVHD mouse animals. (c) Quantification of the histology staining shown. At the left is one representative section per group. At the right is the number of CXCL7 per scale in the spleen. CXCL7 were detected by colocalization of CXCL7 (green) and DAPI (blue). CXCL7 deposition was quantified on a 0-3 scale to determine the amount of antibodies in the tissues. (d) Representative spleen histology staining revealing the expression of CXCL7 (brown) 7 d after HSCT in auto-HSCT and allo-HSCT mice. Cells were stained with CXCL7 (brown). Bars: 50 or 200 μm. p < 0.05 and ∗∗p < 0.01. The y-axis is the log2 scale of the expression level of hub genes. Each experiment was performed at least three times, and the results were presented as mean ± SD.

References

    1. Aladağ E., Kelkitli E., Göker H. Acute graft-versus-host disease: a brief review. Turkish Journal of Haematology. 2020;37(1):1–4. doi: 10.4274/tjh.galenos.2019.2019.0157. - DOI - PMC - PubMed
    1. Henden A. S., Hill G. R. Cytokines in graft-versus-host disease. Journal of Immunology. 2015;194(10):4604–4612. doi: 10.4049/jimmunol.1500117. - DOI - PubMed
    1. Naserian S., Leclerc M., Shamdani S., Uzan G. Current preventions and treatments of aGVHD: from pharmacological prophylaxis to innovative therapies. Frontiers in Immunology. 2020;11, article 607030 doi: 10.3389/fimmu.2020.607030. - DOI - PMC - PubMed
    1. Blazar B. R., Murphy W. J., Abedi M. Advances in graft-versus-host disease biology and therapy. Nature Reviews. Immunology. 2012;12(6):443–458. doi: 10.1038/nri3212. - DOI - PMC - PubMed
    1. Hill G. R., Koyama M. Cytokines and costimulation in acute graft-versus-host disease. Blood. 2020;136(4):418–428. doi: 10.1182/blood.2019000952. - DOI - PMC - PubMed

LinkOut - more resources