

Protein Signature Predicts Response to Neoadjuvant Treatment With Chemotherapy and Bevacizumab in HER2-Negative Breast Cancers
- PMID: 34036235
- PMCID: PMC8140811
- DOI: 10.1200/PO.20.00086
Protein Signature Predicts Response to Neoadjuvant Treatment With Chemotherapy and Bevacizumab in HER2-Negative Breast Cancers
Abstract
Purpose: Antiangiogenic therapy using bevacizumab has proven effective for a number of cancers; however, in breast cancer (BC), there is an unmet need to identify patients who benefit from such treatment.
Patients and methods: In the NeoAva phase II clinical trial, patients (N = 132) with large (≥ 25 mm) human epidermal growth factor receptor 2 (HER2)-negative primary tumors were randomly assigned 1:1 to treatment with neoadjuvant chemotherapy (CTx) alone or in combination with bevacizumab (Bev plus CTx). The ratio of the tumor size after relative to before treatment was calculated into a continuous response scale. Tumor biopsies taken prior to neoadjuvant treatment were analyzed by reverse-phase protein arrays (RPPA) for expression levels of 210 BC-relevant (phospho-) proteins. Lasso regression was used to derive a predictor of tumor shrinkage from the expression of selected proteins prior to treatment.
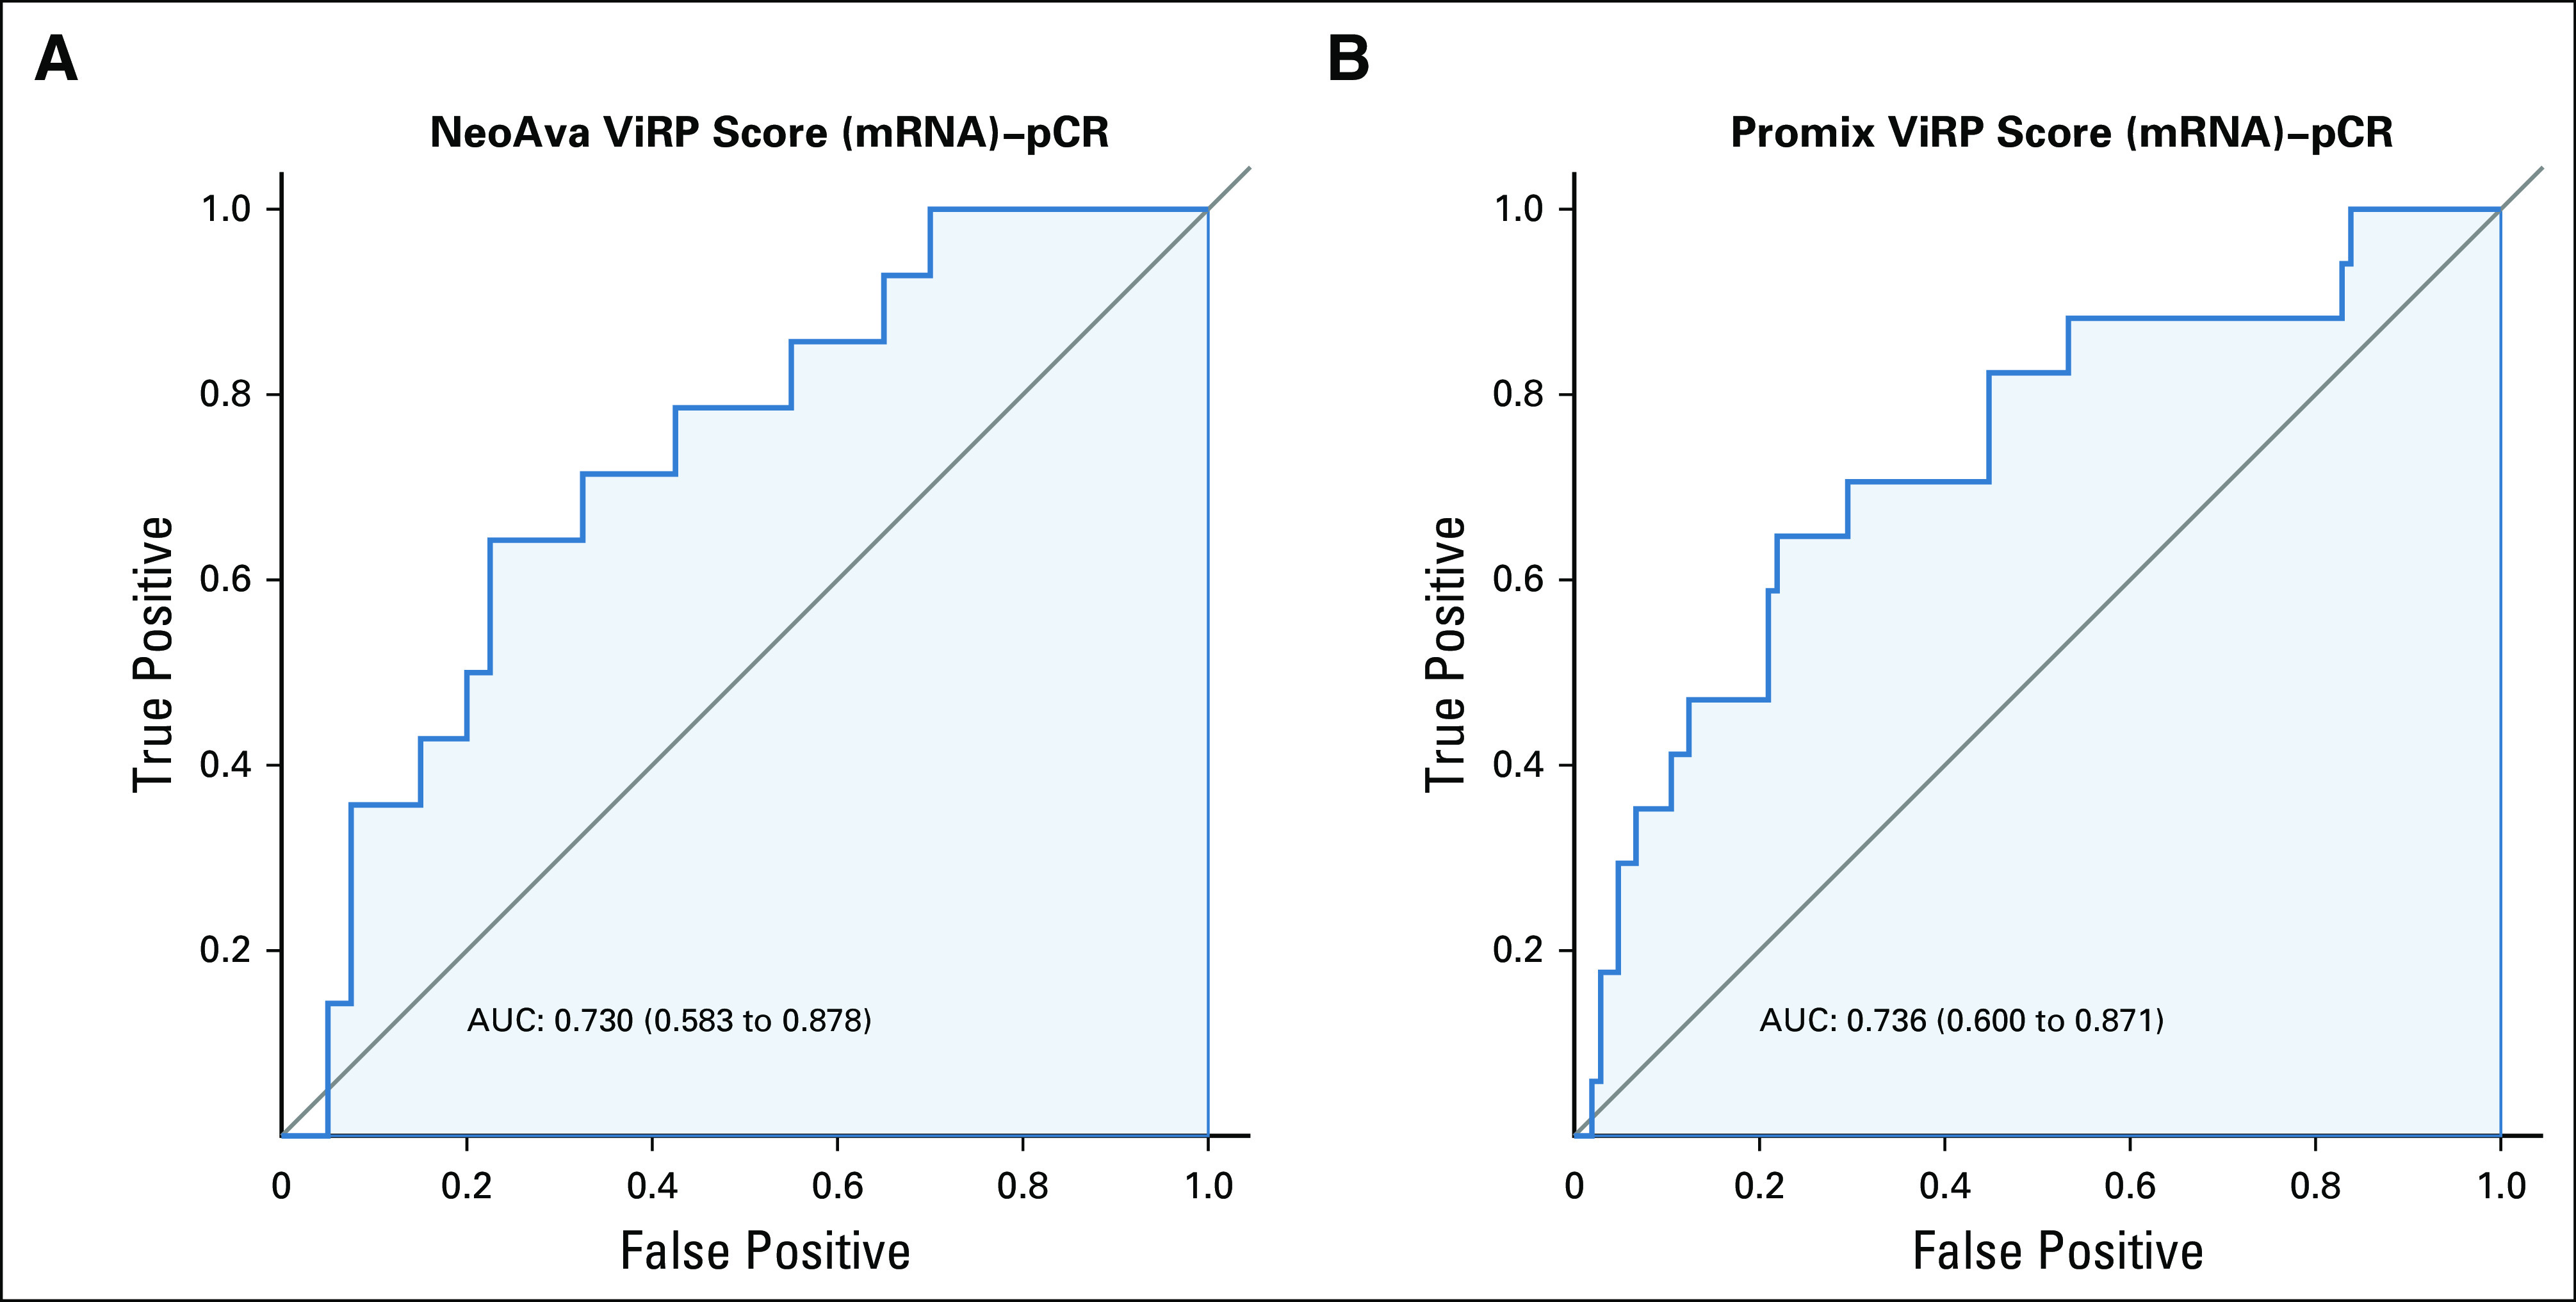
Results: We identified a nine-protein signature score named vascular endothelial growth factor inhibition response predictor (ViRP) for use in the Bev plus CTx treatment arm able to predict with accuracy pathologic complete response (pCR) (area under the curve [AUC] = 0.85; 95% CI, 0.74 to 0.97) and low residual cancer burden (RCB 0/I) (AUC = 0.80; 95% CI, 0.68 to 0.93). The ViRP score was significantly lower in patients with pCR (P < .001) and in patients with low RCB (P < .001). The ViRP score was internally validated on mRNA data and the resultant surrogate mRNA ViRP score significantly separated the pCR patients (P = .016). Similarly, the mRNA ViRP score was validated (P < .001) in an independent phase II clinical trial (PROMIX).
Conclusion: Our ViRP score, integrating the expression of nine proteins and validated on mRNA data both internally and in an independent clinical trial, may be used to increase the likelihood of benefit from treatment with bevacizumab combined with chemotherapy in patients with HER2-negative BC.
© 2021 by American Society of Clinical Oncology.
Conflict of interest statement
The following represents disclosure information provided by authors of this manuscript. All relationships are considered compensated unless otherwise noted. Relationships are self-held unless noted. I = Immediate Family Member, Inst = My Institution. Relationships may not relate to the subject matter of this manuscript. For more information about ASCO’s conflict of interest policy, please refer to www.asco.org/rwc or ascopubs.org/cci/author-center. Open Payments is a public database containing information reported by companies about payments made to US-licensed physicians (Open Payments). Mads H. HaugenPatents, Royalties, Other Intellectual Property: Patent application 62/969770 to USPTOOle Christian LingjærdeConsulting or Advisory Role: NovartisThomas HatschekConsulting or Advisory Role: Roche, Pfizer, Pierre Fabre Research Funding: Roche, Pfizer Travel, Accommodations, Expenses: RocheAnne-Lise Børresen-DaleEmployment: Arctic Pharma AS, PubGene Stock and Other Ownership Interests: Arctic Pharma ASGordon B. MillsStock and Other Ownership Interests: Catena, SignalChem, Tarveda Therapeutics, ImmunoMET Honoraria: Nuevolution: AstraZeneca, Tarveda Therapeutics, Tesaro, Symphogen, PDX Pharmacy, ImmunoMET, Lilly Consulting or Advisory Role: AstraZeneca, SignalChem, Tarveda Therapeutics, Symphogen, Takeda/Millennium, PDX Pharmacy, ImmunoMET, Lilly, Turbine, ION Pharma, Zentalis Research Funding: Adelson Medical Research Foundation, AstraZeneca, NanoString Technologies, Breast Cancer Research Foundation, Karus Therapeutics, Pfizer, Prospect Creek Foundation, Tarveda Therapeutics, Ions Pharmaceuticals, ImmunoMET Patents, Royalties, Other Intellectual Property: HRD assay to Myriad Genetics, DSP technology patent with Nanostring Travel, Accommodations, Expenses: AstraZeneca, Pfizer, Symphogen, Chrysalis Biomedical Advisors, ImmunoMET, Michigan Primary Care ConsortiumGunhild M. MælandsmoPatents, Royalties, Other Intellectual Property: Patent application submitted for a nine-protein/gene panel predicting response to anti VEGF therapies in combination with chemotherapyOlav EngebraatenPatents, Royalties, Other Intellectual Property: Patent application pending for a biomarker for antibody drug conjugates, Patent application submitted for a nine-protein/gene panel predicting response to anti VEGF therapies in combination with chemotherapy No other potential conflicts of interest were reported.
Figures


Similar articles
-
[Efficacy of neoadjuvant chemotherapy combined with bevacizumab versus neoadjuvant chemotherapy alone for Her2-negative breast cancer: a meta-analysis of randomized controlled clinical trials].Zhejiang Da Xue Xue Bao Yi Xue Ban. 2016 May 25;45(4):379-386. doi: 10.3785/j.issn.1008-9292.2016.07.08. Zhejiang Da Xue Xue Bao Yi Xue Ban. 2016. PMID: 27868411 Free PMC article. Review. Chinese.
-
Immune phenotype of tumor microenvironment predicts response to bevacizumab in neoadjuvant treatment of ER-positive breast cancer.Int J Cancer. 2020 Nov 1;147(9):2515-2525. doi: 10.1002/ijc.33108. Epub 2020 Jun 18. Int J Cancer. 2020. PMID: 32488909 Clinical Trial.
-
Validation of Residual Proliferative Cancer Burden as a Predictor of Long-Term Outcome Following Neoadjuvant Chemotherapy in Patients with Hormone Receptor-Positive/Human Epidermal Growth Receptor 2-Negative Breast Cancer.Oncologist. 2020 Sep;25(9):e1355-e1362. doi: 10.1634/theoncologist.2020-0201. Epub 2020 Jul 21. Oncologist. 2020. PMID: 32618068 Free PMC article.
-
Assessment of early response biomarkers in relation to long-term survival in patients with HER2-negative breast cancer receiving neoadjuvant chemotherapy plus bevacizumab: Results from the Phase II PROMIX trial.Int J Cancer. 2018 Feb 1;142(3):618-628. doi: 10.1002/ijc.31070. Epub 2017 Oct 13. Int J Cancer. 2018. PMID: 28940389 Free PMC article. Clinical Trial.
-
Neoadjuvant Therapy of Cyclin-Dependent Kinase 4/6 Inhibitors Combined with Endocrine Therapy in HR+/HER2- Breast Cancer: A Systematic Review and Meta-Analysis.Oncol Res Treat. 2021;44(10):557-567. doi: 10.1159/000518573. Epub 2021 Aug 12. Oncol Res Treat. 2021. PMID: 34515204
Cited by
-
Plasma Proteome Signature to Predict the Outcome of Breast Cancer Patients Receiving Neoadjuvant Chemotherapy.Cancers (Basel). 2021 Dec 14;13(24):6267. doi: 10.3390/cancers13246267. Cancers (Basel). 2021. PMID: 34944885 Free PMC article.
-
Circulating Proteins Associated with Response and Resistance to Neoadjuvant Chemotherapy in HER2-Positive Breast Cancer.Cancers (Basel). 2022 Feb 21;14(4):1087. doi: 10.3390/cancers14041087. Cancers (Basel). 2022. PMID: 35205837 Free PMC article.
-
The Breast Tumor Microenvironment: A Key Player in Metastatic Spread.Cancers (Basel). 2021 Sep 25;13(19):4798. doi: 10.3390/cancers13194798. Cancers (Basel). 2021. PMID: 34638283 Free PMC article. Review.
-
MRI Assessment of Changes in Tumor Vascularization during Neoadjuvant Anti-Angiogenic Treatment in Locally Advanced Breast Cancer Patients.Cancers (Basel). 2023 Sep 21;15(18):4662. doi: 10.3390/cancers15184662. Cancers (Basel). 2023. PMID: 37760629 Free PMC article.
-
An integrated omics approach highlights how epigenetic events can explain and predict response to neoadjuvant chemotherapy and bevacizumab in breast cancer.Mol Oncol. 2024 Aug;18(8):2042-2059. doi: 10.1002/1878-0261.13656. Epub 2024 Apr 26. Mol Oncol. 2024. PMID: 38671580 Free PMC article.
References
-
- Ferrara N, Adamis AP.Ten years of anti-vascular endothelial growth factor therapy Nat Rev Drug Discov 15385–4032016 - PubMed
-
- Miller K, Wang M, Gralow J, et al. Paclitaxel plus bevacizumab versus paclitaxel alone for metastatic breast cancer N Engl J Med 3572666–26762007 - PubMed
-
- Roviello G, Bachelot T, Hudis CA, et al. The role of bevacizumab in solid tumours: A literature based meta-analysis of randomised trials Eur J Cancer 75245–2582017 - PubMed
Publication types
MeSH terms
Substances
Grants and funding
LinkOut - more resources
Full Text Sources
Other Literature Sources
Medical
Research Materials
Miscellaneous
