. 2021 May 13;2(2):100537.
doi: 10.1016/j.xpro.2021.100537. eCollection 2021 Jun 18.

Isolation of mouse brain-infiltrating leukocytes for single cell profiling of epitopes and transcriptomes

Affiliations

Isolation of mouse brain-infiltrating leukocytes for single cell profiling of epitopes and transcriptomes

Ian H Guldner et al. STAR Protoc. .

Abstract

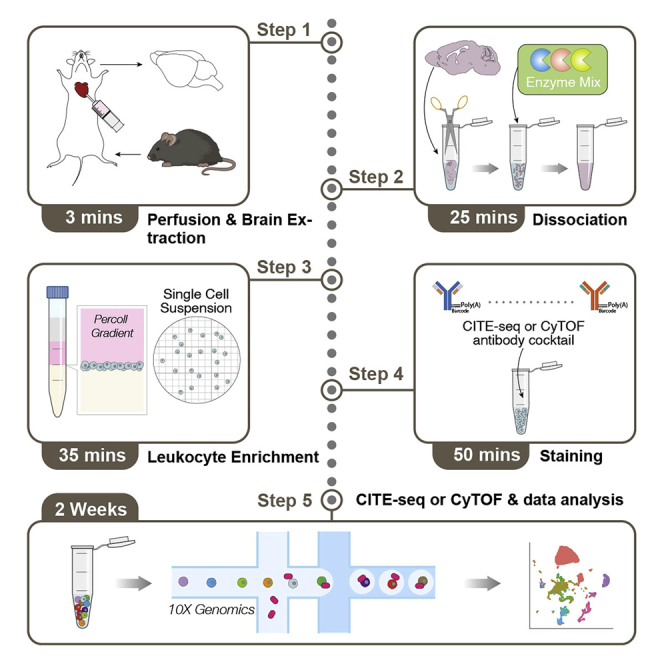
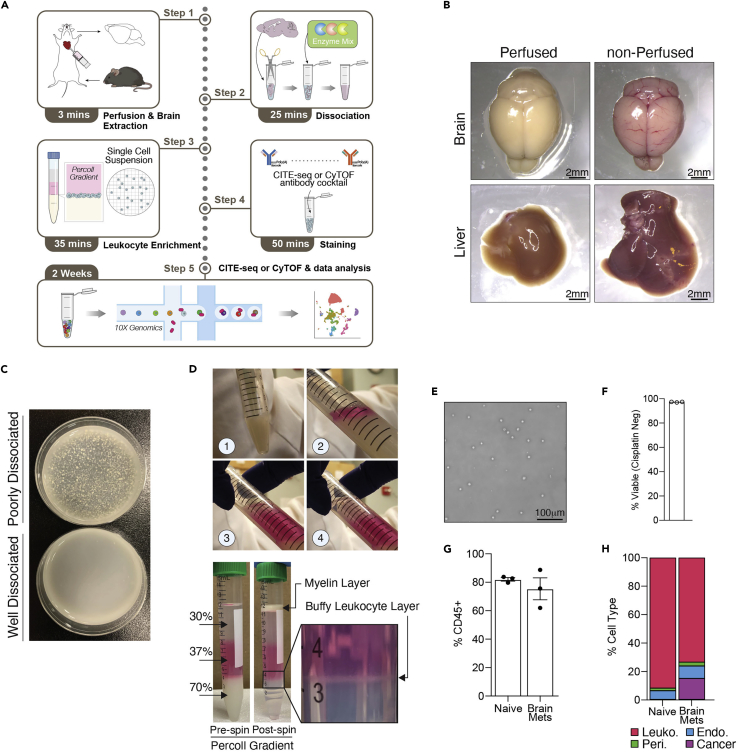
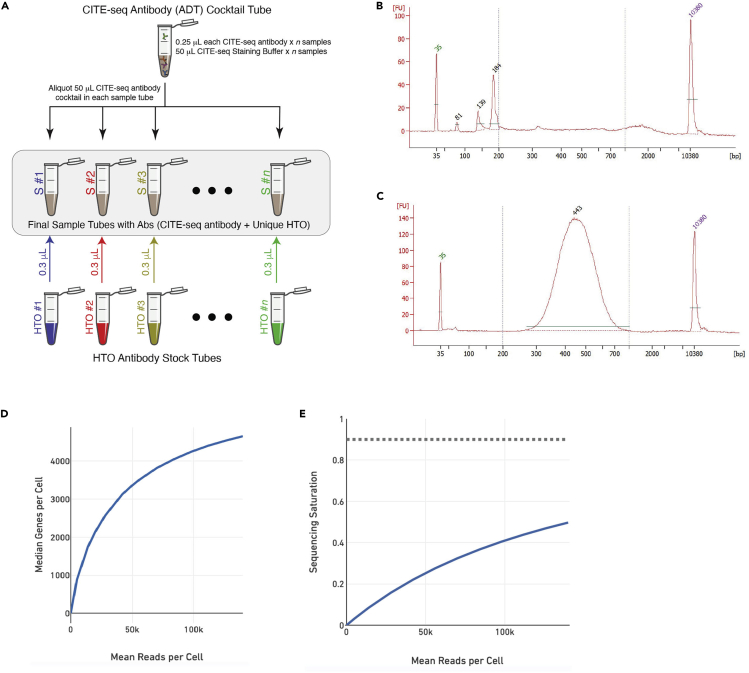
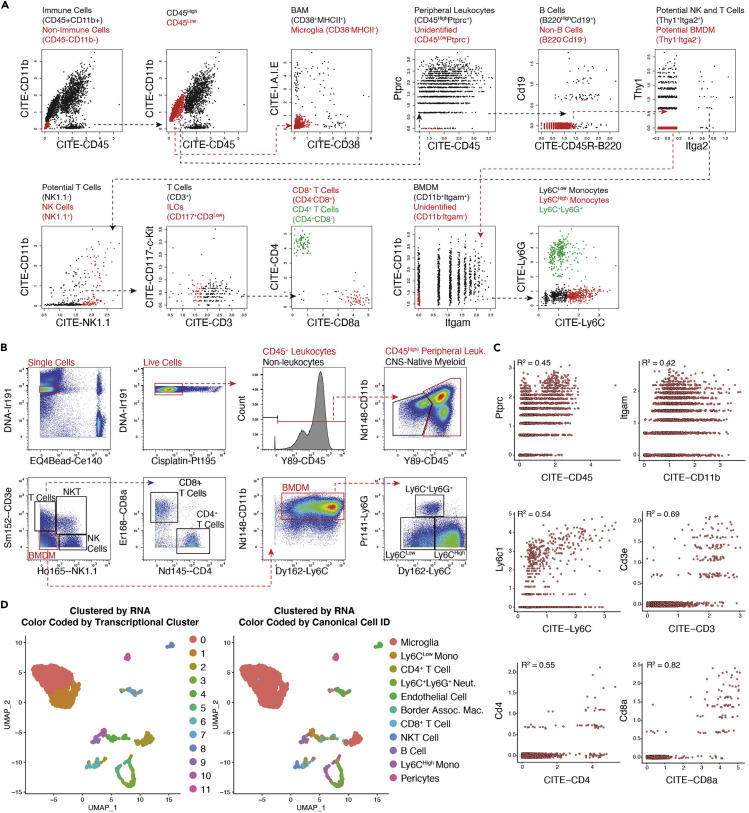
High dimensional compositional and transcriptional profiling of heterogeneous brain-infiltrating leukocytes can lead to novel biological and therapeutic discoveries. High-quality single-cell leukocyte preparations are a prerequisite for optimal single cell profiling. Here, we describe a protocol for epitope and RNA-preserving dissociation of adult mouse brains and subsequent leukocyte purification and staining, which is adaptable to homeostatic and pathogenic brains. Leukocyte preparation following this protocol permits exquisite single-cell surface protein and RNA profiling in applications including CyTOF and CITE-seq. For complete details on the use and execution of this protocol, please refer to Guldner et al. (2020) and Golomb et al. (2020).

Keywords: Cell isolation; Flow Cytometry/Mass Cytometry; Immunology; Neuroscience; RNA-seq; Sequencing; Single Cell.


Conflict of interest statement

The authors declare no competing interests.

Figures

None
Graphical abstract
Figure 1
Figure 1
Isolation of brain-infiltrating leukocytes for single cell profiling of epitopes and transcriptomes (A) Overall protocol schematic. (B) Images of indicated organs without PBS perfusion (right) and with PBS perfusion (left). Scale bar: 2mm. (C) Photograph of dissociated brain at the end of enzymatic dissociation (note there are no tissue chunks present). (D) Photographs of Percoll layering sequences (1-4) and layered Percoll gradient before (lower left) and after (lower middle) centrifugation, with enlarged image pointing out the buffy leukocyte layer post-centrifugation (lower right). (E) Light microscope image of washed leukocytes post-Percoll gradient centrifugation on a hemocytometer (note the lack of debris and single cell nature of suspension). Scale bar: 100mm. (F) Bar chart showing the percent of viable cells following brain dissociation, leukocyte enrichment, and cell staining, as determined by the percent of cisplatin negative/low cells of all single cells in CyTOF experiments. See also Methods video S1. (G) Bar chart derived from CITE-seq data showing percentage of cells sequenced that were leukocytes (CD45+) from the naive and brain metastasis-burdened brain. Error bars represent SEM. (H) Stacked bar chart derived from CITE-seq data showing proportions of all identifiable cells sequenced that were leukocytes (CD45+), endothelial cells, pericytes, or metastatic cancer cells from the naive and brain metastasis-burdened brain.
Figure 2
Figure 2
CITE-seq quality control (A) Schematics of antibody staining process. (B) Representative bioanalyzer electropherograms of CITE-seq antibody (ADT) library showing ADT product peak ~180 bp, which should be the predominant product peak. Smaller peak at ~140 bp is TSO-RT-Oligo product, which could be removed by further SPRI purification. (C) Representative bioanalyzer electropherograms of RNA library with expected library size of ~300-700 bp. (D) Representative CellRanger QC summary plot of mean reads per cell versus median genes per cell. (E) Representative CellRanger QC summary plot of mean reads per cell versus sequencing saturation, with the far right data point indicating full sequencing depth of run.
Figure 3
Figure 3
RNA and antibody-based epitope expression in brain infiltrating leukocytes (A) Example of gating leukocyte populations using CITE antibodies. Briefly, CNS native myeloid cells (microglia and BAM) were gated based on both populations lowly expressing CD45 and then differentiated from each other based on higher I-A-I-E and CD38 expression in BAM. Peripheral leukocytes were gated based on high CD45 expression. Within the peripheral leukocyte population: B cells were defined as having CD19 and B220 expression. T cells were defined based on high CD3 expression and low NK1.1 expression, then subpopulations further distinguished on the basis of CD4 and CD8 expression. Myeloid cells were distinguished from adaptive peripheral immune cells by high CD11b expression, and then further subdivided on the basis of Ly6C expression levels and Ly6G expression. (B) Example of gating leukocyte populations using CyTOF antibodies. (C) Biaxial plots of CITE epitope expression on the x axis and its corresponding mRNA expression on the y axis. Discordant expression of mRNA and protein can be observed. (D) UMAPs derived from CITE-seq data clustered by RNA transcription cluster color coded by transcriptional cluster (left) or canonical cell ID determined by CITE-antibody gating (right). While canonically identified cells generally group within the same cluster, there is appreciable dispersion of canonical cell types among clusters, indicating the utility in using CITE antibody tags rather than mRNA alone to identify canonical cell types.

References

    1. Bandura D.R., Baranov V.I., Ornatsky O.I., Antonov A., Kinach R., Lou X., Pavlov S., Vorobiev S., Dick J.E., Tanner S.D. Mass cytometry: technique for real time single cell multitarget immunoassay based on inductively coupled plasma time-of-flight mass spectrometry. Anal. Chem. 2009;81:6813–6822. - PubMed
    1. Golomb S.M., Guldner I.H., Zhao A., Wang Q., Palakurthi B., Aleksandrovic E.A., Lopez J.A., Lee S.W., Yang K., Zhang S. Multi-modal single-cell analysis reveals brain immune landscape plasticity during aging and gut microbiota dysbiosis. Cell Rep. 2020;33:108438. - PMC - PubMed
    1. Guldner I.H., Wang Q., Yang L., Golomb S.M., Zhao Z., Lopez J.A., Brunory A., Howe E.N., Zhang Y., Palakurthi B. CNS-native myeloid cells drive immune suppression in the brain metastatic niche through Cxcl10. Cell. 2020;183:1234–1248.e25. - PMC - PubMed
    1. Ihaka R., Gentleman R. R: a language for data analysis and graphics. J. Comput. Graph. Stat. 1996;5:299–314.
    1. Lee J.-K., Tansey M.G. Microglia isolation from adult mouse brain. Methods Mol. Biol. 2013;1041:17–23. - PMC - PubMed

Publication types

LinkOut - more resources