. 2021 May 3;10(6):31.
doi: 10.1167/tvst.10.6.31.

A Simple Subjective Evaluation of Enface OCT Reflectance Images Distinguishes Glaucoma From Healthy Eyes

Affiliations

A Simple Subjective Evaluation of Enface OCT Reflectance Images Distinguishes Glaucoma From Healthy Eyes

Riccardo Cheloni et al. Transl Vis Sci Technol. .

Abstract

Purpose: We present a subjective approach to detecting glaucomatous defects in enface images and assess its diagnostic performance. We also test the hypothesis that if reflectivity changes precede thickness changes in glaucoma there should be reduced correlation between the modalities in glaucoma compared to controls.

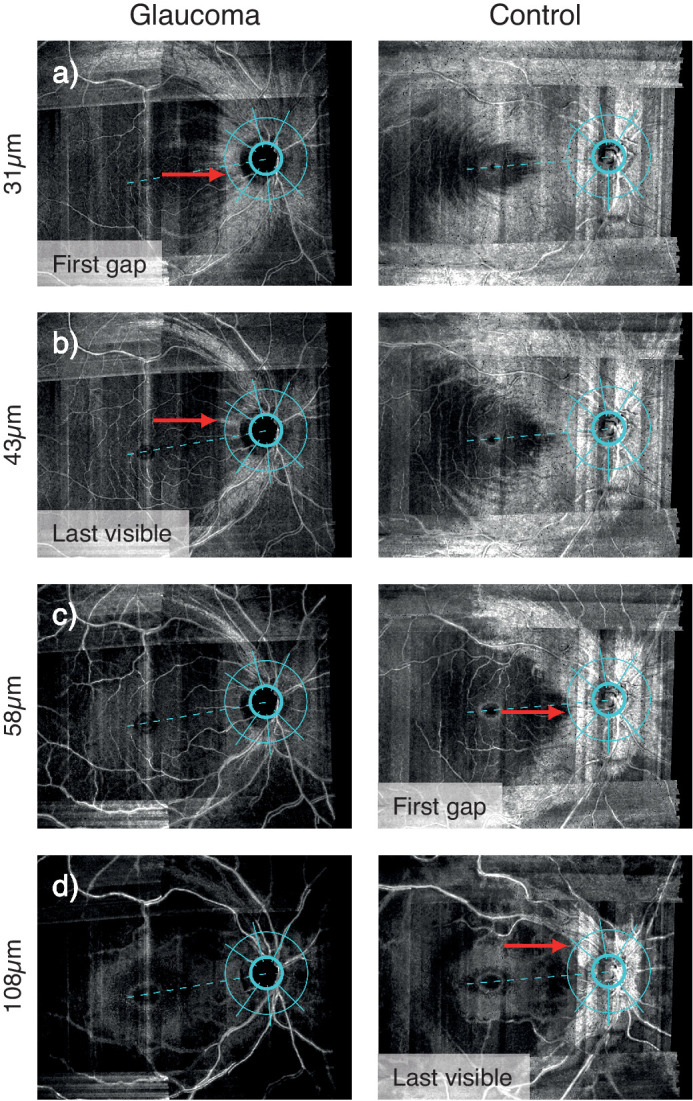
Methods: Twenty glaucoma participants and 20 age-matched controls underwent high-resolution OCT scans of one eye. 4 µm-thick enface slabs were constructed through the retina. Enface indices were depths of first gap in visible retinal nerve fiber bundles (RNFBs) and last visible bundle, subjectively evaluated in six sectors of a 3.5 mm circle around the optic disc. Retinal nerve fiber layer thickness (RNFLT) along the same circle was extracted at angles corresponding to enface indices. Between-group differences were tested by linear mixed models. Diagnostic performance was measured by partial receiver operating characteristic area (pAUC).

Results: First gap and last visible bundle were closer to the inner limiting membrane in glaucoma eyes (both P < 0.0001). Enface indices showed excellent diagnostic performance (pAUCs 0.63-1.00), similar to RNFLT (pAUCs 0.63-0.95). Correlation between enface and RNFLT parameters was strong in healthy (r = 0.81-0.92) and glaucoma eyes (r = 0.73-0.80).

Conclusions: This simple subjective method reliably identifies glaucomatous defects in enface images with diagnostic performance at least as good as existing thickness indices. Thickness and reflectivity were similarly related in healthy and glaucoma eyes, providing no strong evidence of reflectivity loss preceding thinning. Objective analyses may realize further potential of enface OCT images in glaucoma.

Translational relevance: Novel enface OCT indices may aid glaucoma diagnosis.


Conflict of interest statement

Disclosure: R. Cheloni, None; S.D. Dewsberry, None; J. Denniss, Heidelberg Engineering GmbH (F)

Figures

Figure 1.
Figure 1.
Example of how visible presence of RNFBs (93 µm below ILM) changes in a healthy eye and at different stages of glaucoma. The images are single pixel deep enface OCT images without depth-averaging. At this depth, RNFBs are still visible all around the optic disc in the healthy eye, whereas RNFBs have already disappeared in the rest of the retina where the slab encompasses deeper and hyporeflective retinal layers. In the early glaucoma eye (central panel) a substantial loss of RNFBs can be seen in the temporal and temporal inferior sectors, with no visible presence of RNFBs. In the more advanced glaucoma eye (right panel) no bundles are visible around the optic disc or elsewhere, with the only hyperreflective elements provided by blood vessels. An animated version of this figure, showing a range of depths below the ILM, is provided in Supplementary Figure S1. MD = mean deviation.
Figure 2.
Figure 2.
Example of the task in the temporal sector for a glaucoma eye (left panels) and an age-similar healthy participant (right panels). In (a) the red arrow shows the first gap for the glaucoma eye at 31 µm below the ILM, whereas the corresponding depth for the healthy eye is reached at 58 µm below the ILM (red arrow in c). The depth of last visible bundle (Last visible) was 43 µm (red arrow in b) and 108 µm (red arrow in d) below the ILM for the glaucoma and healthy eye, respectively.
Figure 3.
Figure 3.
Circumpapillary RNFL thickness (RNFLT) profiles for the same control and glaucoma eye as shown in Figure 2. Points marked by F and L represent the RNFL thickness at the angles corresponding to the enface measures of first gap and last visible bundle, respectively. For both eyes and in every ONH sector, RNFL thicknesses at angle of first gap (F) were smaller than thicknesses at angle of last visible bundle (L), hence appearing lower on the y-axis. TMP = temporal, TS = temporal superior, NS = nasal superior, NAS = nasal, NI = nasal inferior, TI = temporal inferior.
Figure 4.
Figure 4.
Boxplots showing differences between glaucoma and control eyes for the first gap (a) and last visible bundle (b) for every ONH sector and the sectors-average. At each ONH sector, control and glaucoma data are reported by the left-most and right-most box, respectively, and color-coded accordingly. After Bonferroni correction (14 comparisons), pairwise differences were considered significant when P < 0.0036, and flagged with (*). Boxes report medians and 25th to 75th percentiles. Whiskers represent maximum and minimum values of data within 1.5× interquartile range above or below the limits of the box. Unfilled symbols represent outliers. ONH sectors acronyms as per Figure 3; AVG = average.
Figure 5.
Figure 5.
Relationships between (a) first gap & (b) last visible bundle with RNFL thickness at the corresponding angle in each sector of the ONH. Points are color coded and shaped according to disease status. The Pearson correlation coefficients are computed with data from both glaucoma and healthy eyes combined (black), as well as grouping data according to disease status (color coded accordingly). In the combined group, all correlation coefficients were P < 0.0001. All correlation coefficients from data grouped according to disease status were P < 0.001, with the exception of last visible bundle at NS and NAS in controls (P = 0.02 and 0.002, respectively) and NAS and NI first gap in glaucoma eyes (P = 0.012 and 0.005, respectively). ONH sectors are labeled as in Figure 3.
Figure 6.
Figure 6.
Pearson's correlation coefficients and their 95% CI for first gap (a) & last visible bundle (b) and corresponding RNFL thickness at each ONH sector. Top panel in each plot reports the overall correlation and its 95% CI limits, computed with repeated measure correlation (RMCorr). ONH sectors are labeled as in Figure 3.

References

    1. Prum BE Jr., Rosenberg LF, Gedde SJ, et al. .. Primary open-angle glaucoma preferred practice pattern guidelines. Ophthalmology. 2016; 123(1): p41–p111. - PubMed
    1. National Institute of Health and Care Excellence. Glaucoma: diagnosis and management 2017 [Available from: https://www.nice.org.uk/guidance/ng81]. - PubMed
    1. Mwanza JC, Lee G, Budenz DL, et al. .. Validation of the UNC OCT index for the diagnosis of early glaucoma. Transl Vis Sci Technol. 2018; 7(2): 16. - PMC - PubMed
    1. Fallon M, Valero O, Pazos M, Anton A. Diagnostic accuracy of imaging devices in glaucoma: a meta-analysis. Surv Ophthalmol. 2017; 62(4): 446–461. - PubMed
    1. Tatham AJ, Medeiros FA, Zangwill LM, Weinreb RN.. Strategies to improve early diagnosis in glaucoma. Prog Brain Res. 2015; 221: 103–133. - PubMed

Publication types