

Automated Identification of Referable Retinal Pathology in Teleophthalmology Setting
- PMID: 34036304
- PMCID: PMC8161696
- DOI: 10.1167/tvst.10.6.30
Automated Identification of Referable Retinal Pathology in Teleophthalmology Setting
Abstract
Purpose: This study aims to meet a growing need for a fully automated, learning-based interpretation tool for retinal images obtained remotely (e.g. teleophthalmology) through different imaging modalities that may include imperfect (uninterpretable) images.
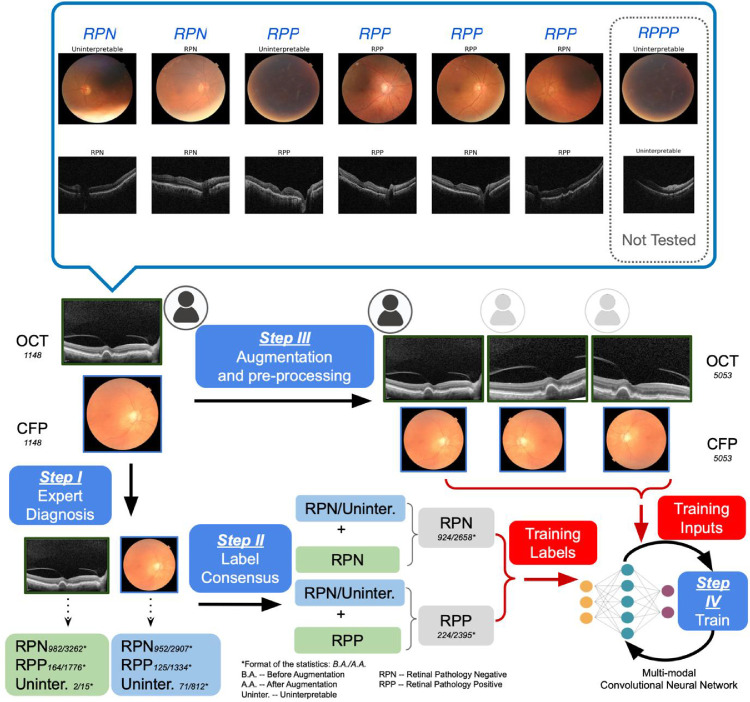
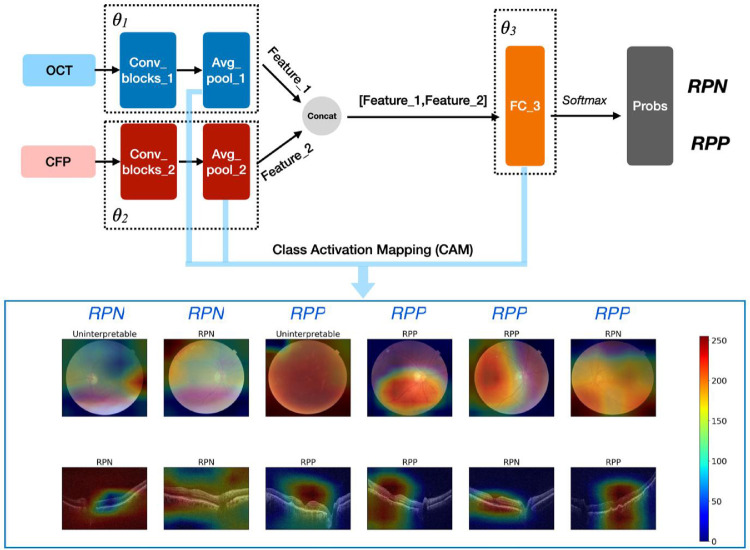
Methods: A retrospective study of 1148 optical coherence tomography (OCT) and color fundus photography (CFP) retinal images obtained using Topcon's Maestro care unit on 647 patients with diabetes. To identify retinal pathology, a Convolutional Neural Network (CNN) with dual-modal inputs (i.e. CFP and OCT images) was developed. We developed a novel alternate gradient descent algorithm to train the CNN, which allows for the use of uninterpretable CFP/OCT images (i.e. ungradable images that do not contain sufficient image biomarkers for the reviewer to conclude absence or presence of retinal pathology). Specifically, a 9:1 ratio to split the training and testing dataset was used for training and validating the CNN. Paired CFP/OCT inputs (obtained from a single eye of a patient) were grouped as retinal pathology negative (RPN; 924 images) in the absence of retinal pathology in both imaging modalities, or if one of the imaging modalities was uninterpretable and the other without retinal pathology. If any imaging modality exhibited referable retinal pathology, the corresponding CFP/OCT inputs were deemed retinal pathology positive (RPP; 224 images) if any imaging modality exhibited referable retinal pathology.
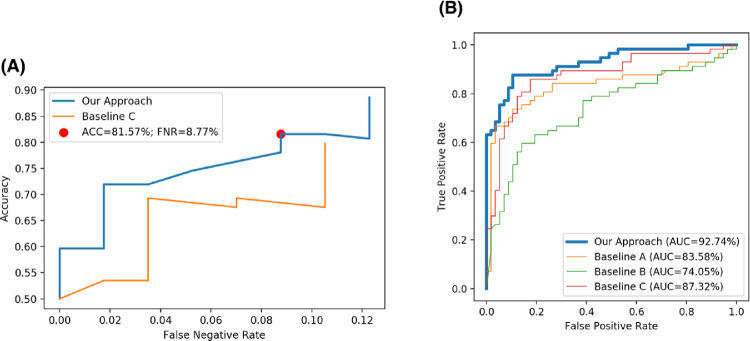
Results: Our approach achieved 88.60% (95% confidence interval [CI] = 82.76% to 94.43%) accuracy in identifying pathology, along with the false negative rate (FNR) of 12.28% (95% CI = 6.26% to 18.31%), recall (sensitivity) of 87.72% (95% CI = 81.69% to 93.74%), specificity of 89.47% (95% CI = 83.84% to 95.11%), and area under the curve of receiver operating characteristic (AUC-ROC) was 92.74% (95% CI = 87.71% to 97.76%).
Conclusions: Our model can be successfully deployed in clinical practice to facilitate automated remote retinal pathology identification.
Translational relevance: A fully automated tool for early diagnosis of retinal pathology might allow for earlier treatment and improved visual outcomes.
Conflict of interest statement
Disclosure:
Figures
Similar articles
-
Evaluation of a Remote Diagnosis Imaging Model vs Dilated Eye Examination in Referable Macular Degeneration.JAMA Ophthalmol. 2019 Jul 1;137(7):802-808. doi: 10.1001/jamaophthalmol.2019.1203. JAMA Ophthalmol. 2019. PMID: 31095245 Free PMC article.
-
Fully automated detection of retinal disorders by image-based deep learning.Graefes Arch Clin Exp Ophthalmol. 2019 Mar;257(3):495-505. doi: 10.1007/s00417-018-04224-8. Epub 2019 Jan 4. Graefes Arch Clin Exp Ophthalmol. 2019. PMID: 30610422
-
Advancing glaucoma detection with convolutional neural networks: a paradigm shift in ophthalmology.Rom J Ophthalmol. 2023 Jul-Sep;67(3):222-237. doi: 10.22336/rjo.2023.39. Rom J Ophthalmol. 2023. PMID: 37876506 Free PMC article. Review.
-
Multimodal Retinal Imaging Classification for Parkinson's Disease Using a Convolutional Neural Network.Transl Vis Sci Technol. 2024 Aug 1;13(8):23. doi: 10.1167/tvst.13.8.23. Transl Vis Sci Technol. 2024. PMID: 39136960 Free PMC article.
-
Non-ICGA treatment criteria for Suboptimal Anti-VEGF Response for Polypoidal Choroidal Vasculopathy: APOIS PCV Workgroup Report 2.Ophthalmol Retina. 2021 Oct;5(10):945-953. doi: 10.1016/j.oret.2021.04.002. Epub 2021 Apr 16. Ophthalmol Retina. 2021. PMID: 33866022
Cited by
-
The Present and Future of Artificial Intelligence-Based Medical Image in Diabetes Mellitus: Focus on Analytical Methods and Limitations of Clinical Use.J Korean Med Sci. 2023 Aug 7;38(31):e253. doi: 10.3346/jkms.2023.38.e253. J Korean Med Sci. 2023. PMID: 37550811 Free PMC article. Review.
-
Deep Learning Models for Segmenting Non-perfusion Area of Color Fundus Photographs in Patients With Branch Retinal Vein Occlusion.Front Med (Lausanne). 2022 Jun 30;9:794045. doi: 10.3389/fmed.2022.794045. eCollection 2022. Front Med (Lausanne). 2022. PMID: 35847781 Free PMC article.
-
RobOCTNet: Robotics and Deep Learning for Referable Posterior Segment Pathology Detection in an Emergency Department Population.Transl Vis Sci Technol. 2024 Mar 1;13(3):12. doi: 10.1167/tvst.13.3.12. Transl Vis Sci Technol. 2024. PMID: 38488431 Free PMC article.
-
Incidence of Referable Retinal Disease in Diabetic Patients at a Primary Care Practice.J Vitreoretin Dis. 2021 Oct 4;6(2):138-146. doi: 10.1177/24741264211044223. eCollection 2022 Mar-Apr. J Vitreoretin Dis. 2021. PMID: 37008662 Free PMC article.
References
-
- Schmidt-Erfurth U, Sadeghipour A, Gerendas BS, Waldstein SM, Bogunović H.. Artificial intelligence in retina. Prog Retin Eye Res. 2018; 67: 1–29. - PubMed
-
- Gargeya R, Leng T.. Automated identification of diabetic retinopathy using deep learning. Ophthalmology. 2017; 124(7): 962–969. - PubMed
-
- Winder RJ, Morrow PJ, McRitchie IN, Bailie JR, Hart PM.. Algorithms for digital image processing in diabetic retinopathy. Comput Med Imaging Graph. 2009; 33(8): 608–622. - PubMed
-
- Usher D, Dumskyj M, Himaga M, Williamson TH, Nussey S, Boyce J.. Automated detection of diabetic retinopathy in digital retinal images: a tool for diabetic retinopathy screening. Diabetic Med. 2004; 21(1): 84–90. - PubMed
MeSH terms
LinkOut - more resources
Full Text Sources
Other Literature Sources
Medical
Miscellaneous
