

Timing and temperature thresholds of heat stress effects on fertility performance of different parity sows in Spanish herds
- PMID: 34036340
- PMCID: PMC8259845
- DOI: 10.1093/jas/skab173
Timing and temperature thresholds of heat stress effects on fertility performance of different parity sows in Spanish herds
Abstract
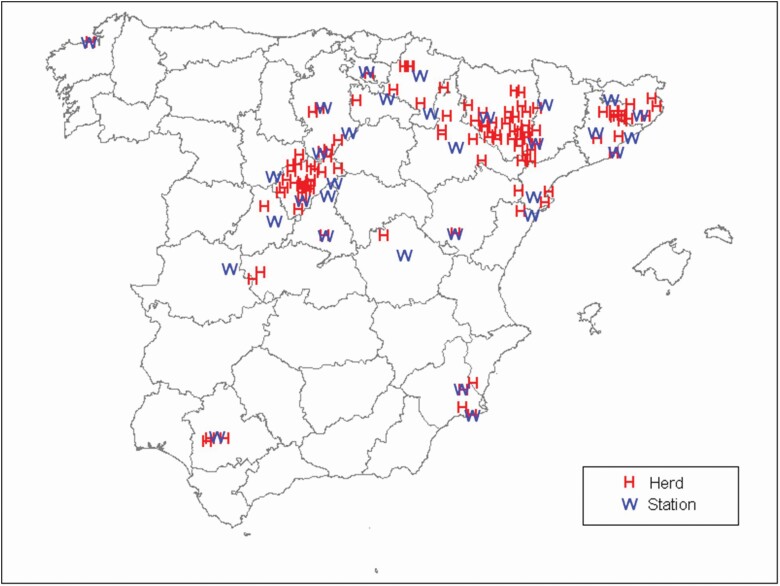
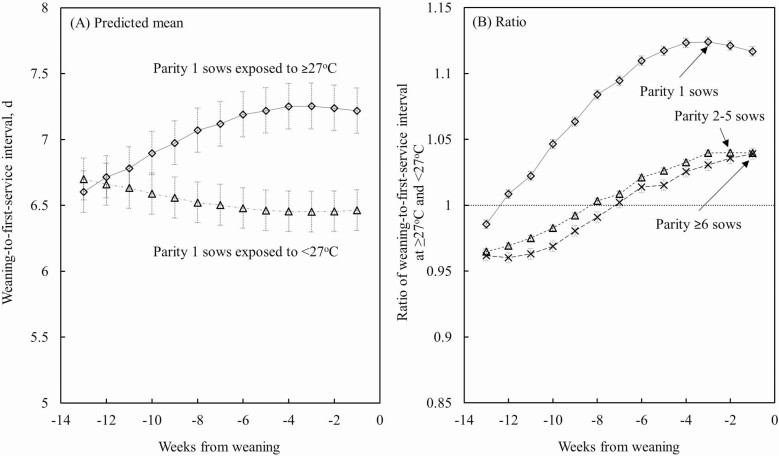
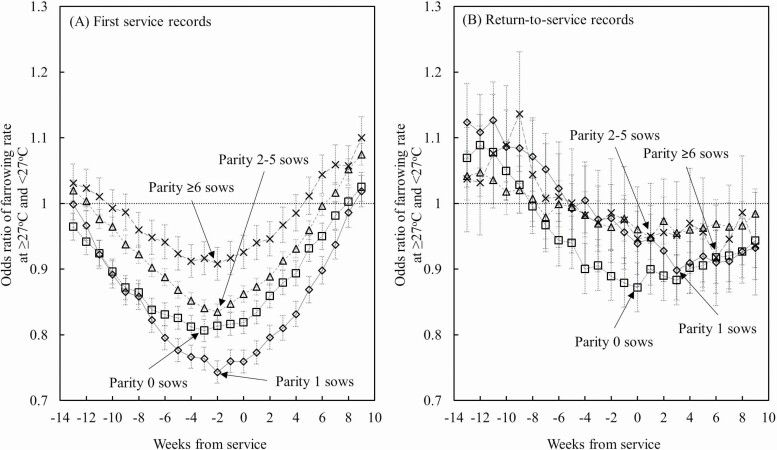
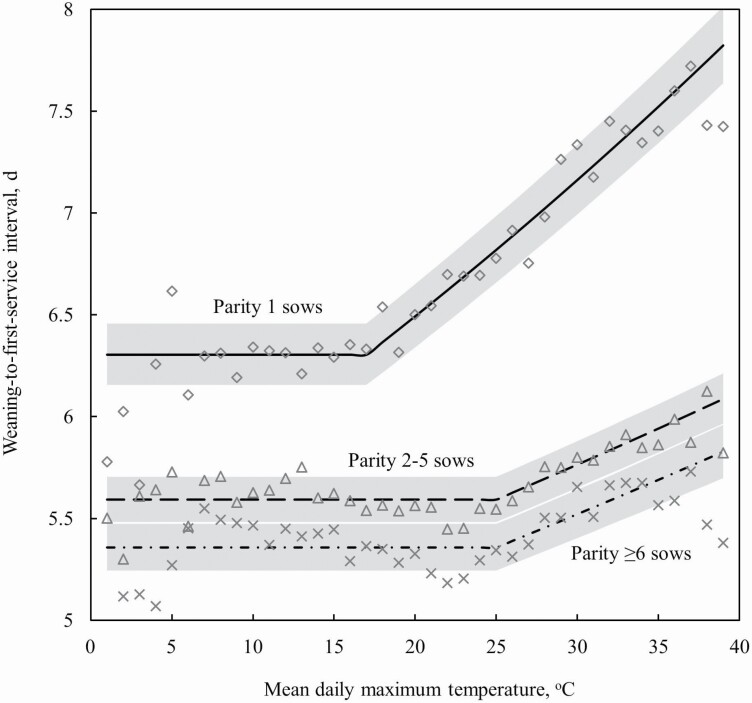
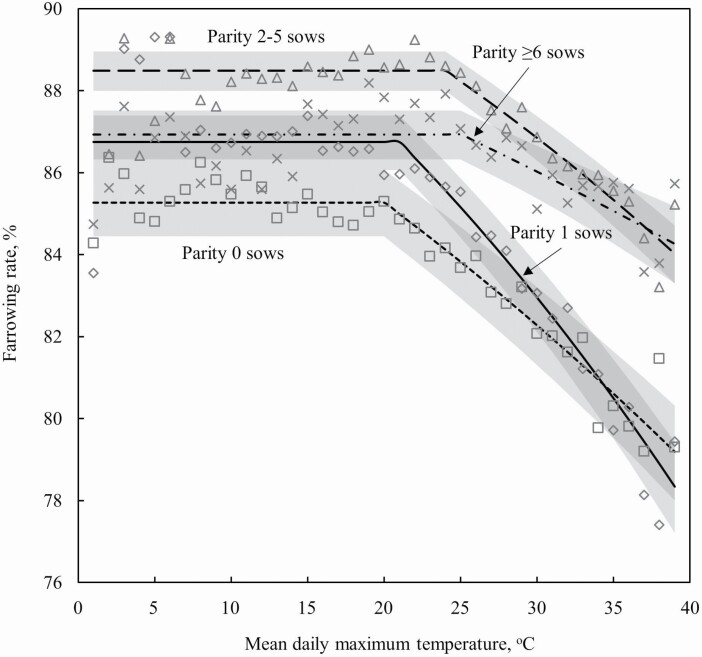
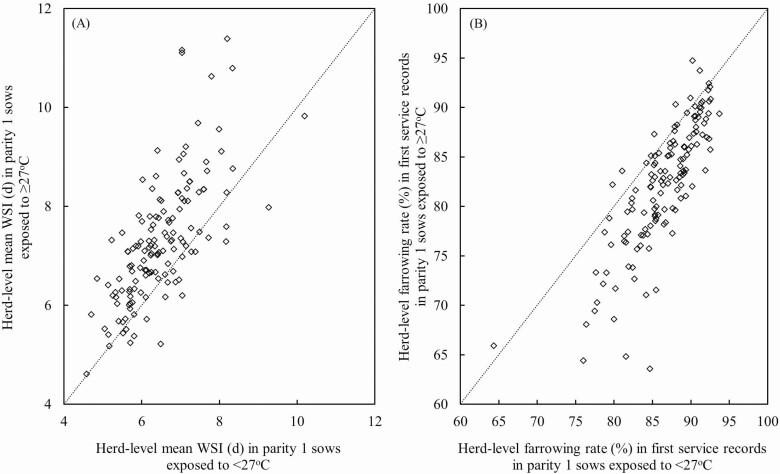
High temperature is an environmental factor that impairs sow fertility. In this study, we identified the critical weeks for heat stress effects on aspects of fertility performance, namely weaning-to-first-service interval (WSI) and farrowing rate (FR). We also examined the threshold temperatures above which the fertility performance deteriorated and whether there were any differences between parities regarding heat stress effects or thresholds. Performance data of sows in 142 herds from 2011 to 2016 were matched to appropriate weekly averaged daily maximum temperatures (Tmax) from weather stations close to the herds. Two types of ratios (i.e., ratio for WSI and odds ratio for FR) were used to identify the critical weeks for heat stress by comparing the respective measures for two sow groups based on Tmax in different weeks around weaning or service events. The ratios for WSI were calculated between groups of sows exposed to Tmax ≥ 27 °C or <27 °C in each week before weaning, with the Tmax cutoff value based on a recent review study. Similarly, the odds ratios for FR for the two groups were calculated in weeks around service. The weeks with the largest differences in the fertility measures between the two Tmax groups (i.e., the highest ratio for WSI and the lowest odds ratio for FR) were considered to be the critical weeks for heat stress. Also, piecewise models with different breakpoints were constructed to identify the threshold Tmax in the critical week. The breakpoint in the best-fit model was considered to be the threshold Tmax. The highest ratios for WSI were obtained at 1 to 3 wk before weaning in parity 1 and 2 or higher sow groups. The threshold Tmax leading to prolonged WSI was 17 °C for parity 1 sows and 25 °C for parity 2 or higher sows. Increasing Tmax by 10 °C above these thresholds increased WSI by 0.65, and 0.33 to 0.35 d, respectively (P < 0.01). For FR, the lowest odds ratios were obtained at 2 to 3 wk before service in parity 0, 1, and 2 or higher sow groups. The threshold Tmax leading to reductions in FR was 20, 21, and 24 to 25 °C for parity 0, 1, and 2 or higher sow groups, respectively. Increasing Tmax by 10 °C above these thresholds decreased FR by 3.0%, 4.3%, and 1.9% to 2.8%, respectively (P < 0.01). These results indicate that the critical weeks for heat stress were 2 to 3 wk before service for FR and 1 to 3 wk before weaning for WSI. The decreases in fertility performance in parity 0 to 1 sows started at temperatures 3 to 8 °C lower than in parity 2 or higher sows.
Keywords: climatic factor; cross-sectional study; estrus resumption; porcine reproduction; seasonal infertility; segmented regression.
© The Author(s) 2021. Published by Oxford University Press on behalf of the American Society of Animal Science. All rights reserved. For permissions, please e-mail: journals.permissions@oup.com.
Figures
Similar articles
-
Effect of birth litter size, birth parity number, growth rate, backfat thickness and age at first mating of gilts on their reproductive performance as sows.Anim Reprod Sci. 2001 May 31;66(3-4):225-37. doi: 10.1016/s0378-4320(01)00095-1. Anim Reprod Sci. 2001. PMID: 11348784
-
Reproductive performance of purebred landrace and Yorkshire sows in Thailand with special reference to seasonal influence and parity number.Theriogenology. 2000 Aug;54(3):481-96. doi: 10.1016/S0093-691X(00)00364-2. Theriogenology. 2000. PMID: 11051330
-
Interactions between pre- or postservice climatic factors, parity, and weaning-to-first-mating interval for total number of pigs born of female pigs serviced during hot and humid or cold seasons.J Anim Sci. 2014 Sep;92(9):4180-8. doi: 10.2527/jas.2014-7636. Epub 2014 Jul 14. J Anim Sci. 2014. PMID: 25023804
-
Farm data analysis for lifetime performance components of sows and their predictors in breeding herds.Porcine Health Manag. 2020 Sep 18;6:24. doi: 10.1186/s40813-020-00163-1. eCollection 2020. Porcine Health Manag. 2020. PMID: 32963803 Free PMC article. Review.
-
Physiological and metabolic aspects of follicular developmental competence as affected by lactational body condition loss.Mol Reprod Dev. 2023 Jul;90(7):491-502. doi: 10.1002/mrd.23628. Epub 2022 Jul 1. Mol Reprod Dev. 2023. PMID: 35775400 Review.
Cited by
-
Productive and metabolomic consequences of arginine supplementation in sows during different gestation periods in two different seasons.J Anim Sci Biotechnol. 2024 Sep 19;15(1):121. doi: 10.1186/s40104-024-01079-4. J Anim Sci Biotechnol. 2024. PMID: 39294768 Free PMC article.
-
Effect of Season and Parity on Reproduction Performance of Iberian Sows Bred with Duroc Semen.Animals (Basel). 2021 Nov 16;11(11):3275. doi: 10.3390/ani11113275. Animals (Basel). 2021. PMID: 34828007 Free PMC article.
-
Ambient temperature and female infertility prevalence: an ecological study based on the 2019 global burden of disease study.Reprod Biol Endocrinol. 2025 Feb 22;23(1):27. doi: 10.1186/s12958-025-01365-4. Reprod Biol Endocrinol. 2025. PMID: 39987432 Free PMC article.
-
Maternal supplementation of Lonicera flos and Scutellaria Baicalensis mixed extracts improve reproduction performance and metabolic health through modulating gut microbiota during pregnancy.BMC Vet Res. 2025 May 1;21(1):305. doi: 10.1186/s12917-025-04753-5. BMC Vet Res. 2025. PMID: 40312723 Free PMC article.
-
Pen Versus Crate: A Comparative Study on the Effects of Different Farrowing Systems on Farrowing Performance, Colostrum Yield and Piglet Preweaning Mortality in Sows under Tropical Conditions.Animals (Basel). 2023 Jan 8;13(2):233. doi: 10.3390/ani13020233. Animals (Basel). 2023. PMID: 36670773 Free PMC article.
References
-
- Almond, G. W., Flowers W. L., Batista L., and D’Allaire S.. . 2006. Diseases of the reproductive system. In: Straw B. E., Zimmerman J. J., D’Allaire S., and Taylor D. J., editors. Diseases of swine. 9th ed. Ames (IA): Iowa State University Press; p. 113–147.
-
- AMNET . 2017. Spanish state meteorological agency Agencia Estatal de Meteorología. [Accessed 23 August 2017]. http://www.aemet.es.
-
- Anil, S. S., Larriestra A., Deen J., and Anil L.. . 2005. A path analysis of the factors associated with seasonal variation of breeding failure in sows. Can. J. Anim. Sci. 85:317–325. doi:10.4141/A05-006 - DOI
MeSH terms
Grants and funding
LinkOut - more resources
Full Text Sources
Other Literature Sources
