. 2021 Oct 28;138(17):1615-1627.
doi: 10.1182/blood.2020007401.

Impairment of human terminal erythroid differentiation by histone deacetylase 5 deficiency

Affiliations

Impairment of human terminal erythroid differentiation by histone deacetylase 5 deficiency

Yaomei Wang et al. Blood. .

Erratum in

Abstract

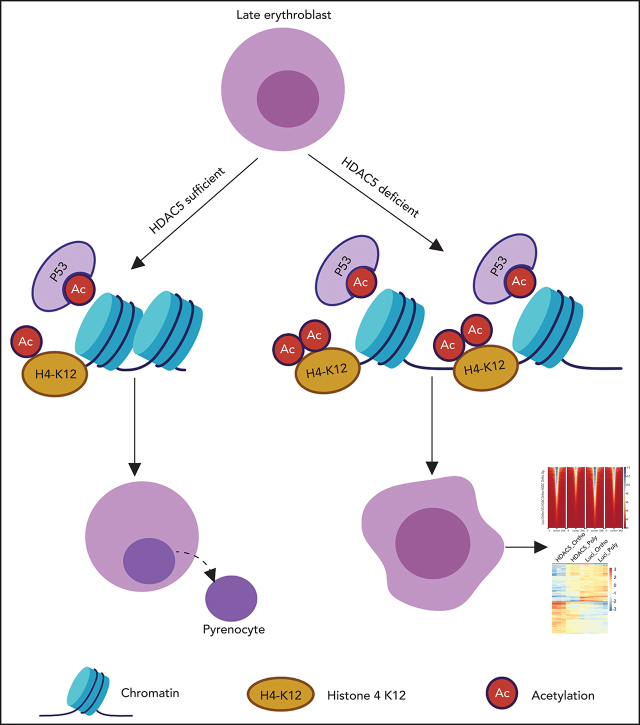
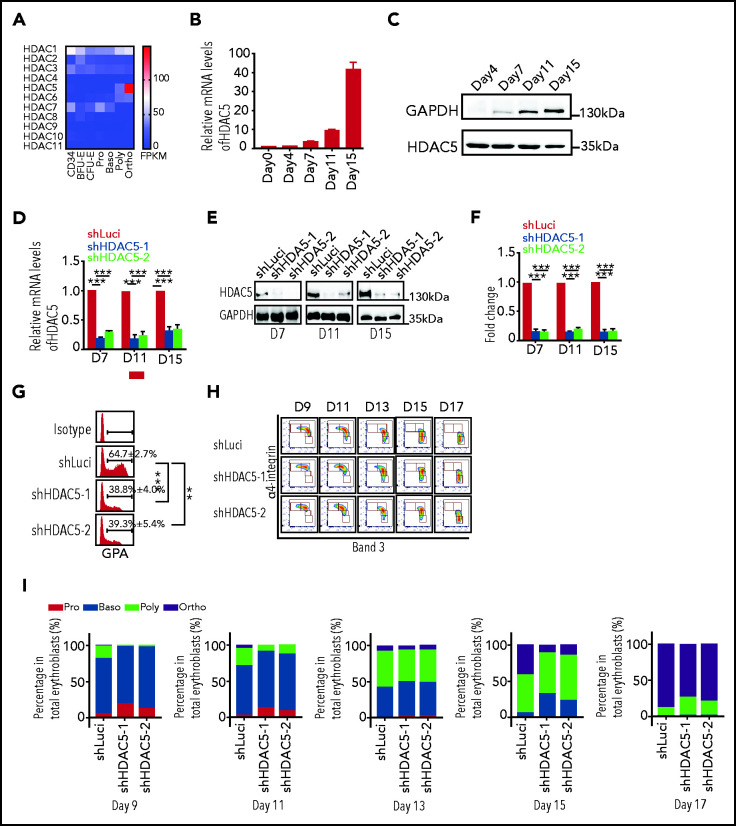
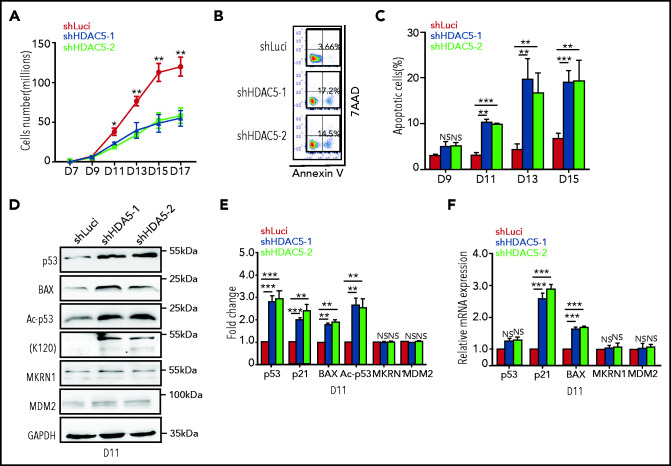
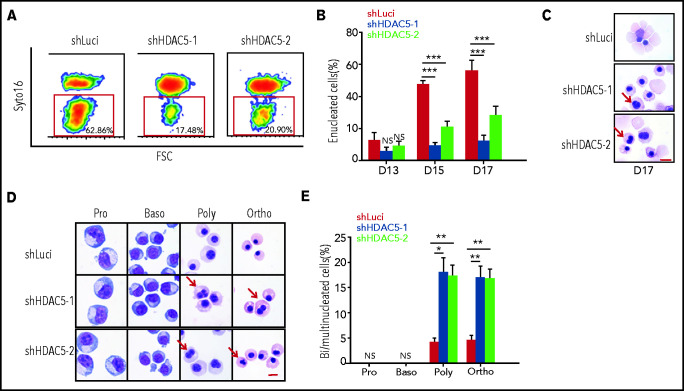
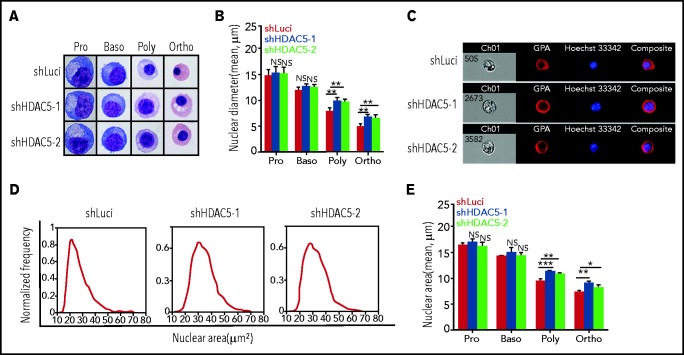
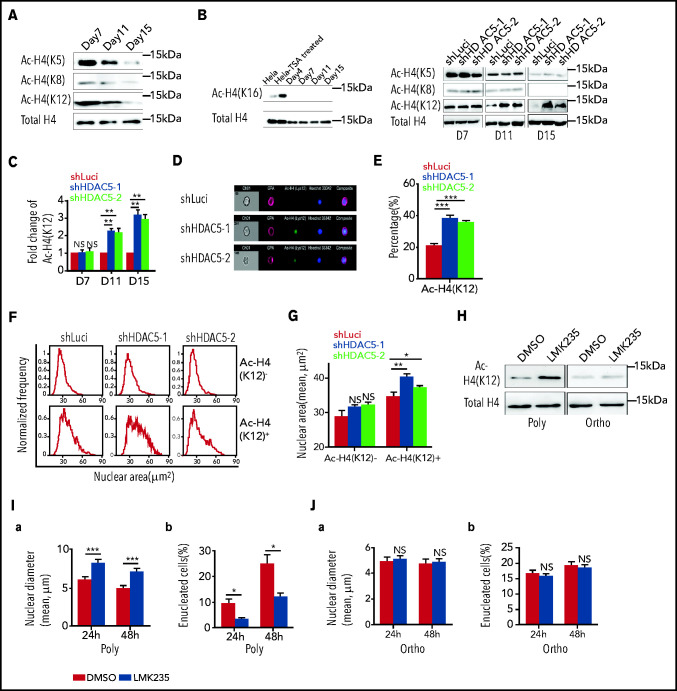
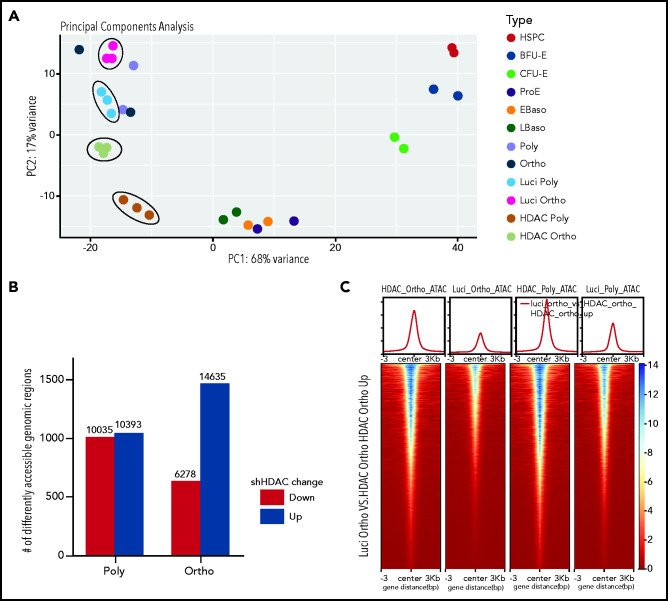
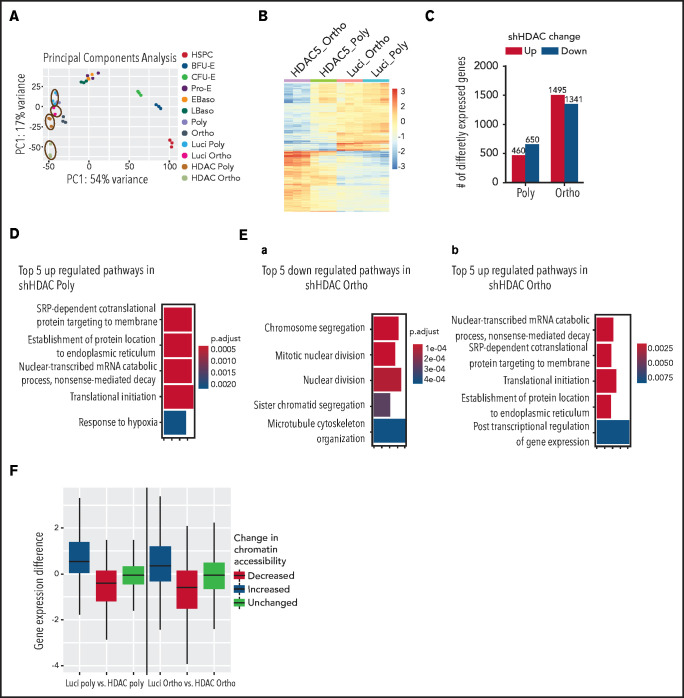
Histone deacetylases (HDACs) are a group of enzymes that catalyze the removal of acetyl groups from histone and nonhistone proteins. HDACs have been shown to have diverse functions in a wide range of biological processes. However, their roles in mammalian erythropoiesis remain to be fully defined. This study showed that, of the 11 classic HDAC family members, 6 (HDAC1, -2, -3, and HDAC5, -6, -7) are expressed in human erythroid cells, with HDAC5 most significantly upregulated during terminal erythroid differentiation. Knockdown of HDAC5 by either short hairpin RNA or small interfering RNA in human CD34+ cells followed by erythroid cell culture led to increased apoptosis, decreased chromatin condensation, and impaired enucleation of erythroblasts. Biochemical analyses revealed that HDAC5 deficiency resulted in activation of p53 in association with increased acetylation of p53. Furthermore, although acetylation of histone 4 (H4) is decreased during normal terminal erythroid differentiation, HDAC5 deficiency led to increased acetylation of H4 (K12) in late-stage erythroblasts. This increased acetylation was accompanied by decreased chromatin condensation, implying a role for H4 (K12) deacetylation in chromatin condensation. ATAC-seq and RNA sequencing analyses revealed that HDAC5 knockdown leads to increased chromatin accessibility genome-wide and global changes in gene expression. Moreover, pharmacological inhibition of HDAC5 by the inhibitor LMK235 also led to increased H4 acetylation, impaired chromatin condensation, and enucleation. Taken together, our findings have uncovered previously unrecognized roles and molecular mechanisms of action for HDAC5 in human erythropoiesis. These results may provide insights into understanding the anemia associated with HDAC inhibitor treatment.


Figures

None
Graphical abstract
Figure 1.
Figure 1.
Effects of HDAC5 knockdown on terminal erythroid differentiation. (A) Heat map showing mRNA levels of HDACs, as assessed by RNA-seq in erythroblasts. (B) qRT-PCR results showing HDAC5 mRNA expression levels in erythroblasts cultured for 0, 4, 7, 11, and 15 days . β-Actin was used as the internal reference. Data are expressed as the mean ± SD of triplicate samples. (C) Representative western blots showing HDAC5 protein levels in erythroblasts cultured for 4, 7, 11, and 15 days. (D) qRT-PCR results showing HDAC5 mRNA expression levels in luciferase-shRNA (shLuci) or HDAC5-shRNAs (shHDAC5) transduced erythroblasts cultured for 7, 11, and 15 days. β-Actin was used as the internal reference. Data are expressed as the mean ± SD of triplicate samples. (E) Representative western blot showing HDAC5 protein levels in shLuci- or shHDAC5-transduced erythroblasts cultured for 7, 11, and 15 days. (F) Quantitative analysis of HDAC5 protein levels from 3 independent experiments. (G) Flow cytometry analysis showing the percentage of GPA+ cells on day 7. (H) Flow cytometry analysis showing the expression of α4-integrin and band 3 on erythroid cells cultured for the days indicated. (I) Quantitative analyses of erythroblasts at distinct stages. (D,F-G) **P < .01; ***P < .001. GADPH, glyceraldehyde-3-phosphate dehydrogenase; NS, nonsignificant.
Figure 2.
Figure 2.
HDAC5 knockdown leads to increased apoptosis caused by activation of the p53 pathway. (A) Growth curves of cells transduced with lentivirus containing luciferase-shRNA or HDAC5-shRNAs. (B) Representative flow cytometry profiles of apoptosis as assessed by dual staining of annexin V and 7AAD at day 13 of culture. (C) Quantitative analysis of apoptosis from 3 independent experiments. (D) Representative western blot analyses of molecules, as indicated on day 11 cultured erythroblasts. (E) Quantitative analysis of the western blot results from 3 independent experiments. (F) qRT-PCR analyses of the molecules as indicated on day 11 cultured erythroblasts. (A,C,E-F) *P < .05; **P < .01; ***P < .001; NS, nonsignificant. GAPDH, glyceraldehyde-3-phosphate dehydrogenase.
Figure 3.
Figure 3.
Impaired enucleation and generation of abnormal nuclei after HDAC5 knockdown. (A) Representative profiles of enucleation as assessed by SYTO 16 staining on day 17 of culture. The enucleation percentage was calculated as the SYTO 16–negative cells in the total population. (B) Quantitative analysis of enucleation on the indicated days from 3 independent experiments. (C-D) Representative cytospin images of day 17 erythroblasts (C). Representative cytospin images of sorted distinct stages of erythroblasts (D). Red arrows indicate binucleated and multinucleated erythroblasts. Scale br, 10 μm. (E) Quantification of binucleated and multinucleated erythroblasts in sorted erythroblasts at the different developmental stages. (B, E) *P < .05; **P < .01; ***P < .001. Baso, basophilic erythroblasts; Ortho, orthochromatic erythroblasts; Poly, poly chromatic erythroblasts; Pro, proerythroblasts.
Figure 4.
Figure 4.
Impaired chromatin condensation in HDAC5-knockdown polychromatic and orthochromatic erythroblasts. (A) Representative cytospin images of sorted erythroblasts stained with May-Grunwald-Giemsa. Scale bar, 10 μm. (B) Quantitative analysis of nuclear diameter of the sorted erythroblasts at the indicated stages. Cells (n = 1000) of each stage of terminal erythroid differentiation from 3 independent experiments were used for quantification. (C) Representative ImageStream images of orthochromatic erythroblasts stained with GPA and Hoechst 33342. (D) Representative ImageStream nuclear area profiles of orthochromatic erythroblasts. (E) Quantitative analysis of nuclear area of sorted erythroblasts from 3 independent experiments. *P < .05; **P < .01; ***P < .001. NS, nonsignificant. Baso, basophilic erythroblasts; Ortho, orthochromatic erythroblasts; Poly, poly chromatic erythroblasts; Pro, proerythroblasts.
Figure 5.
Figure 5.
Histone 4 acetylation and chromatin condensation. (A) Representative western blots showing changes in histone H4 acetylation (AC-H4) during terminal erythroid differentiation. (B) Representative western blots showing effects of HDAC5 knockdown on H4 acetylation on K5, K8, K12, and K16. (C) Quantitative analysis of H4K12 acetylation levels from 3 independent experiments. (D) Representative ImageStream images of day 17 erythroblasts stained with anti-H4K12, GPA, and Hoechst 33342. (E) Quantitative analysis of H4K12+ erythroblasts. (F) Representative nuclear area profiles of H4K12+ and H4K12 erythroblasts from ImageStream analysis. (G) Quantitative analysis of nuclear area of H4K12+ and H4K12 erythroblasts from 3 different experiments. (H) Effect of LMK235 on H4K12 acetylation in polychromatic and orthochromatic erythroblasts. (I) Effect of LMK235 on chromatin condensation (a) and enucleation (b) of polychromatic erythroblasts. (J) Effect of LMK235 on chromatin condensation (a) and enucleation (b) of orthochromatic erythroblasts. *P < .05; **P < .01; ***P < .001. NS, nonsignificant. Ortho, orthochromatic erythroblasts; Poly, poly chromatic erythroblasts.
Figure 6.
Figure 6.
Effect of HDAC5 knockdown on chromatin accessibility. (A) PCA of ATAC-seq data demonstrates a high degree of separation of samples after treatment with shHDAC5 compared with the control (circled). HDAC5 shRNA-treated and control samples are compared with erythroid stage-specific samples derived from human umbilical cord blood. (B) The number of genomic regions with different chromatin accessibility between control and HDAC5 shRNA-treated cells. HDAC5 knockdown resulted in a large increase in chromatin accessibility in orthochromatic erythroblasts compared with the control. (C) Heat map display of chromatin accessibility levels in genomic regions that become accessible in orthochromatic erythroblasts after treatment with shHDAC5. The top section shows average profiles for all regions, and the bottom section shows levels for individual regions in the 6-kb area surrounding the summits of the ATAC peaks . EBaso, Early-stage basophilic erythroblasts; LBaso, Late-stage basophilic erythroblasts; Ortho, orthochromatic erythroblasts; Poly, poly chromatic erythroblasts; Pro, proerythroblasts.
Figure 7.
Figure 7.
Effect of HDAC5 knockdown on gene expression. (A) PCA of RNA-seq data demonstrating a high degree of separation of samples after treatment with HDAC5 shRNA (circled). HDAC5 shRNA-treated and control samples are compared with erythroid stage-specific samples derived from human umbilical cord blood. (B) Heat map of genes that are differentially expressed between control and HDAC5 shRNA-treated samples. (C) Numbers of genes that are differentially expressed between control and HDAC5 shRNA-treated cells. (D) Gene ontology biological process terms overrepresented in genes that are upregulated in HDAC5-knockdown polychromatic erythroblasts. There were no significant GO terms for downregulated genes in polychromatic erythroblasts. The color represents adjusted P-values, and the width of the bar indicates the number of differential genes in the category. (E) GO biological process terms overrepresented in genes that are downregulate (a) or upregulate (b) in HDAC5-knockdown orthochromatic erythroblasts. The color represents adjusted P-values, and the width of the bar indicates the number of differential genes in the category. (F) Correlation between changes in chromatin accessibility at gene promoters and changes in gene expression. Polychromatic (left) and orthochromatic (right) erythroblasts. Differences in gene expression after HDAC5 shRNA treatment are plotted based on regions of changed accessibility. Baso, basophilic erythroblasts; Ortho, orthochromatic erythroblasts; Poly, poly chromatic erythroblasts; Pro, proerythroblasts.

References

    1. Hu J, Liu J, Xue F, et al. . Isolation and functional characterization of human erythroblasts at distinct stages: implications for understanding of normal and disordered erythropoiesis in vivo. Blood. 2013;121(16):3246-3253. - PMC - PubMed
    1. Lin FK, Suggs S, Lin CH, et al. . Cloning and expression of the human erythropoietin gene. Proc Natl Acad Sci USA. 1985;82(22):7580-7584. - PMC - PubMed
    1. D’Andrea AD, Lodish HF, Wong GG. Expression cloning of the murine erythropoietin receptor. Cell. 1989;57(2):277-285. - PubMed
    1. Koury MJ, Bondurant MC. Erythropoietin retards DNA breakdown and prevents programmed death in erythroid progenitor cells. Science. 1990;248(4953):378-381. - PubMed
    1. Lin CS, Lim SK, D’Agati V, Costantini F. Differential effects of an erythropoietin receptor gene disruption on primitive and definitive erythropoiesis. Genes Dev. 1996;10(2):154-164. - PubMed

Publication types