

Steady-State Serum IgG Trough Levels Are Adequate for Pharmacokinetic Assessment in Patients with Immunodeficiencies Receiving Subcutaneous Immune Globulin
- PMID: 34036490
- PMCID: PMC8310849
- DOI: 10.1007/s10875-021-00990-z
Steady-State Serum IgG Trough Levels Are Adequate for Pharmacokinetic Assessment in Patients with Immunodeficiencies Receiving Subcutaneous Immune Globulin
Abstract
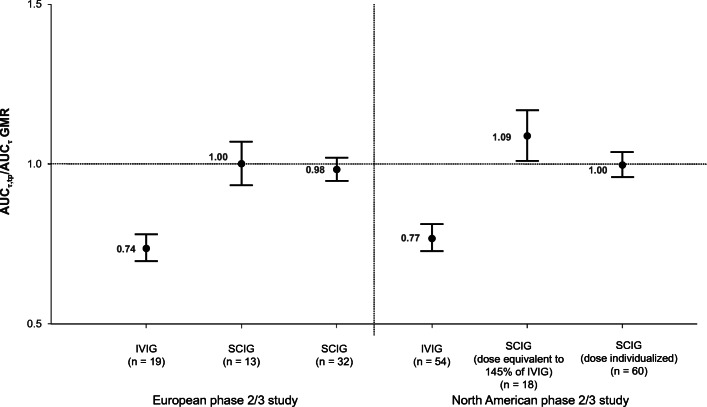
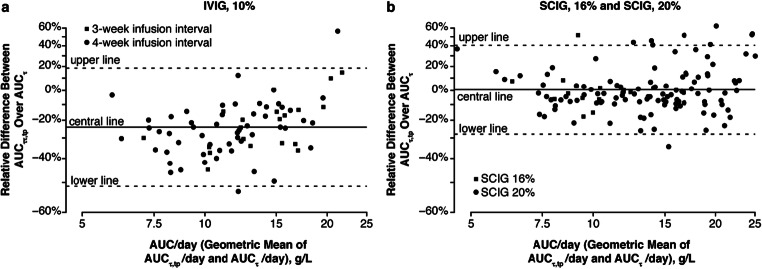
Patients with primary immunodeficiency diseases often require lifelong immunoglobulin (IG) therapy. Most clinical trials investigating IG therapies characterize serum immunoglobulin G (IgG) pharmacokinetic (PK) profiles by serially assessing serum IgG levels. This retrospective analysis evaluated whether steady-state serum IgG trough level measurement alone is adequate for PK assessment. Based on individual patient serum IgG trough levels from two pivotal trials (phase 2/3 European [NCT01412385] and North American [NCT01218438]) of weekly 20% subcutaneous IG (SCIG; Cuvitru, Ig20Gly), trough level-predicted IgG AUC (AUCτ,tp) were calculated and compared with the reported AUC calculated from serum IgG concentration-time profiles (AUCτ). In both studies, mean AUCτ,tp values for Ig20Gly were essentially equivalent to AUCτ with point estimates of geometric mean ratio (GMR) of AUCτ,tp/AUCτ near 1.0 and 90% CIs within 0.80-1.25. In contrast, for IVIG, 10%, mean AUCτ,tp values were lower than AUCτ by >20%, (GMR [90% CI]: 0.74 [0.70-0.78] and 0.77 [0.73-0.81] for the two studies, respectively). Mean AUCτ,tp values calculated for 4 other SCIG products (based on mean IgG trough levels reported in the literature/labels) were also essentially equivalent to the reported AUCτ (differences <10% for all except HyQvia, a facilitated SCIG product), while differences for IVIG products were >20%. In conclusion, steady-state serum IgG levels following weekly SCIG remain stable, allowing for reliable prediction of AUC over the dosing interval using trough IgG levels. These findings indicate that measuring steady-state serum IgG trough levels alone may be adequate for PK assessment of weekly SCIG.
Keywords: Cuvitru; Pharmacokinetics; intravenous immunoglobulin; primary immunodeficiency diseases; subcutaneous immunoglobulin.
© 2021. Ownership of copyright in the Article shall vest in the Rights Holder. When reproducing the Article or extracts from it, the Rights Holder shall acknowledge and reference first publication in the Journal.
Conflict of interest statement
Zhaoyang Li, Barbara McCoy, Werner Engl, and Leman Yel are employees and shareholders of the Takeda group of companies.
Figures
References
-
- Tangye SG, Al-Herz W, Bousfiha A, Chatila T, Cunningham-Rundles C, Etzioni A, et al. Human inborn errors of immunity: 2019 update on the classification from the International Union of Immunological Societies Expert Committee. J Clin Immunol. 2020;40:24–64. doi: 10.1007/s10875-019-00737-x. - DOI - PMC - PubMed
Publication types
MeSH terms
Substances
Associated data
LinkOut - more resources
Full Text Sources
Other Literature Sources
Medical
Research Materials
