

Effect of COVID-19 pandemic on air quality: a study based on Air Quality Index
- PMID: 34036496
- PMCID: PMC8148414
- DOI: 10.1007/s11356-021-14462-9
Effect of COVID-19 pandemic on air quality: a study based on Air Quality Index
Abstract
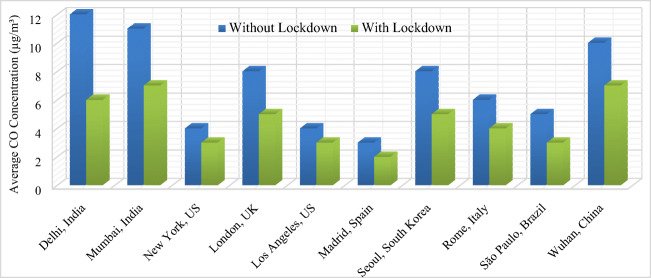
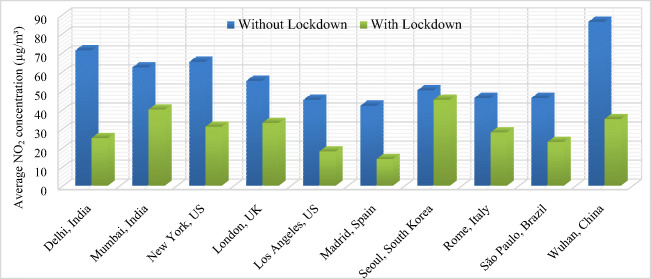
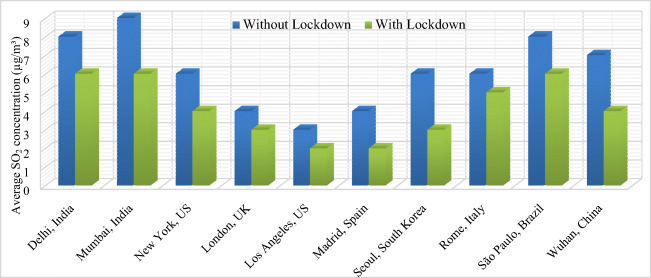
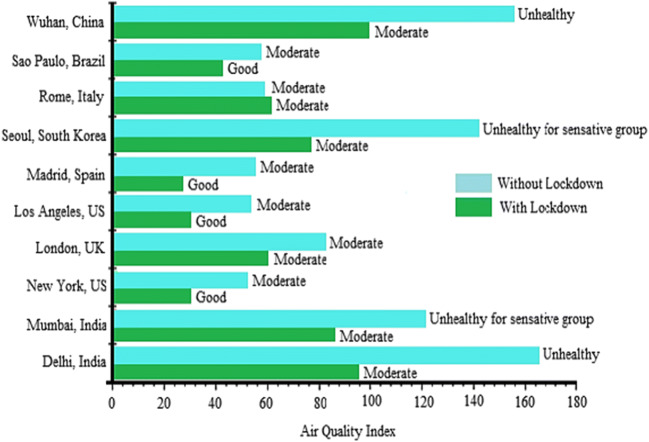
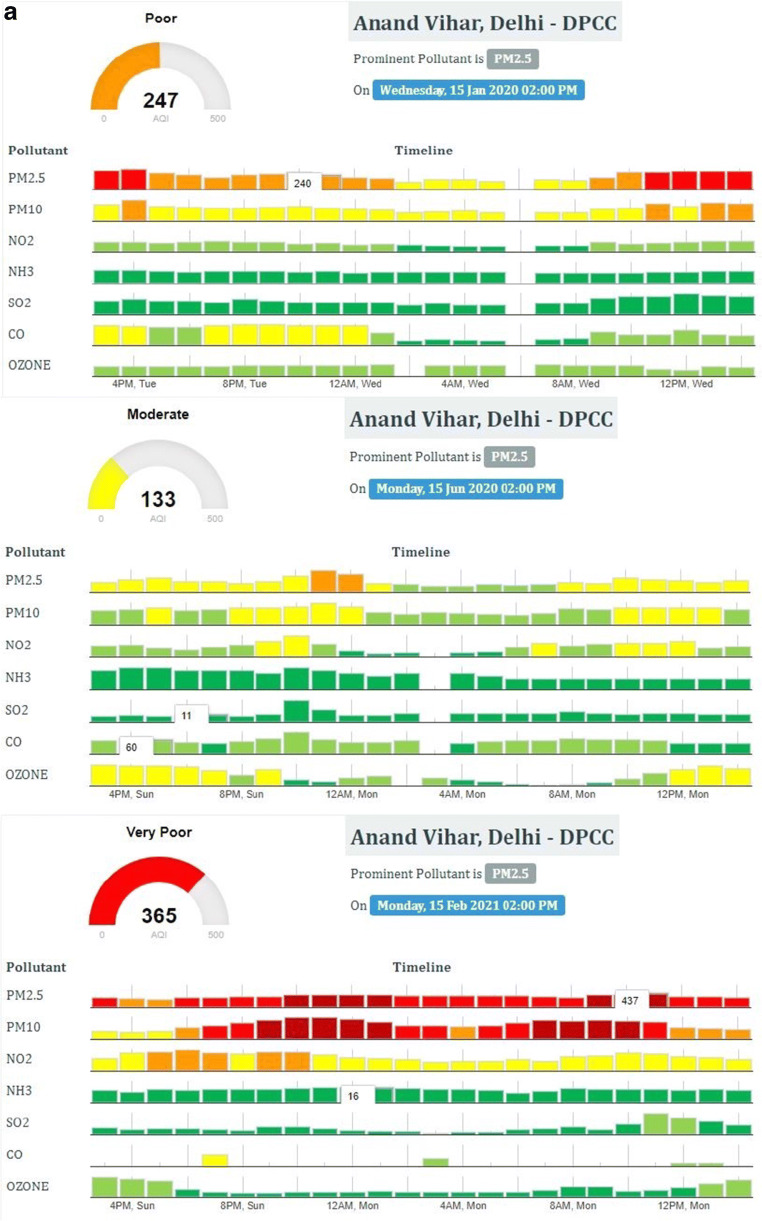
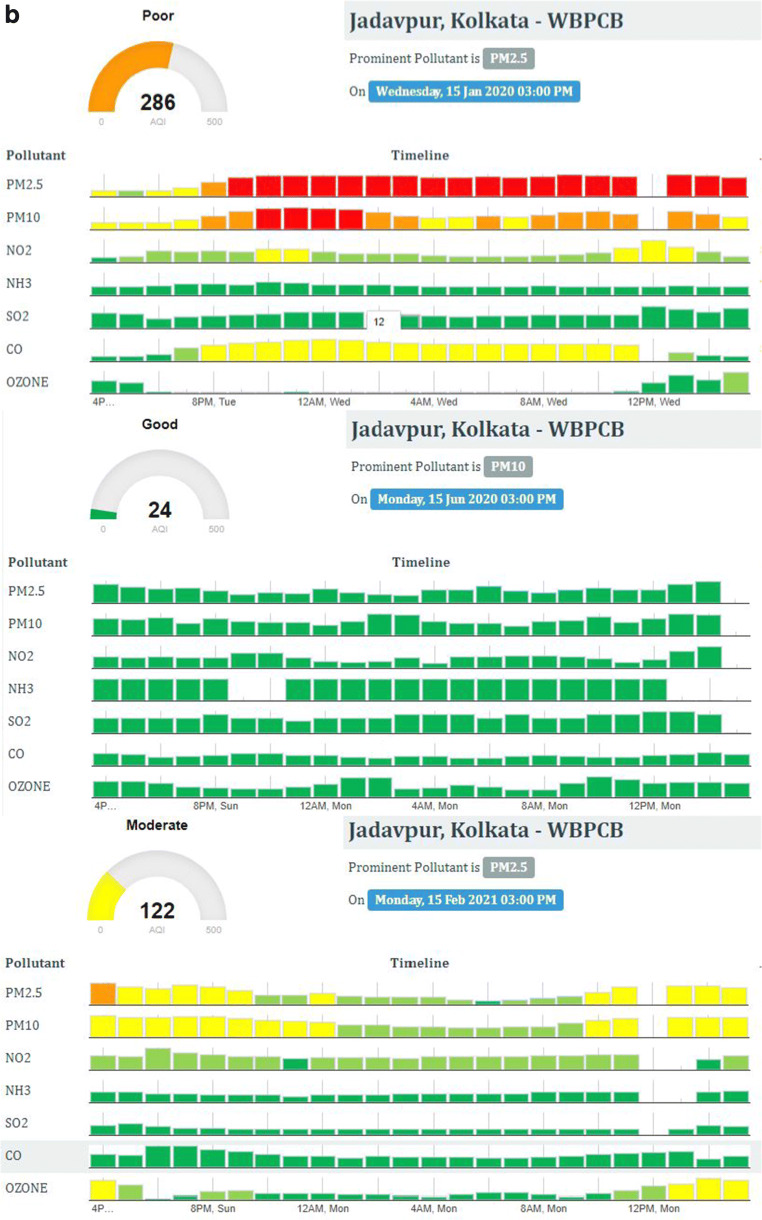
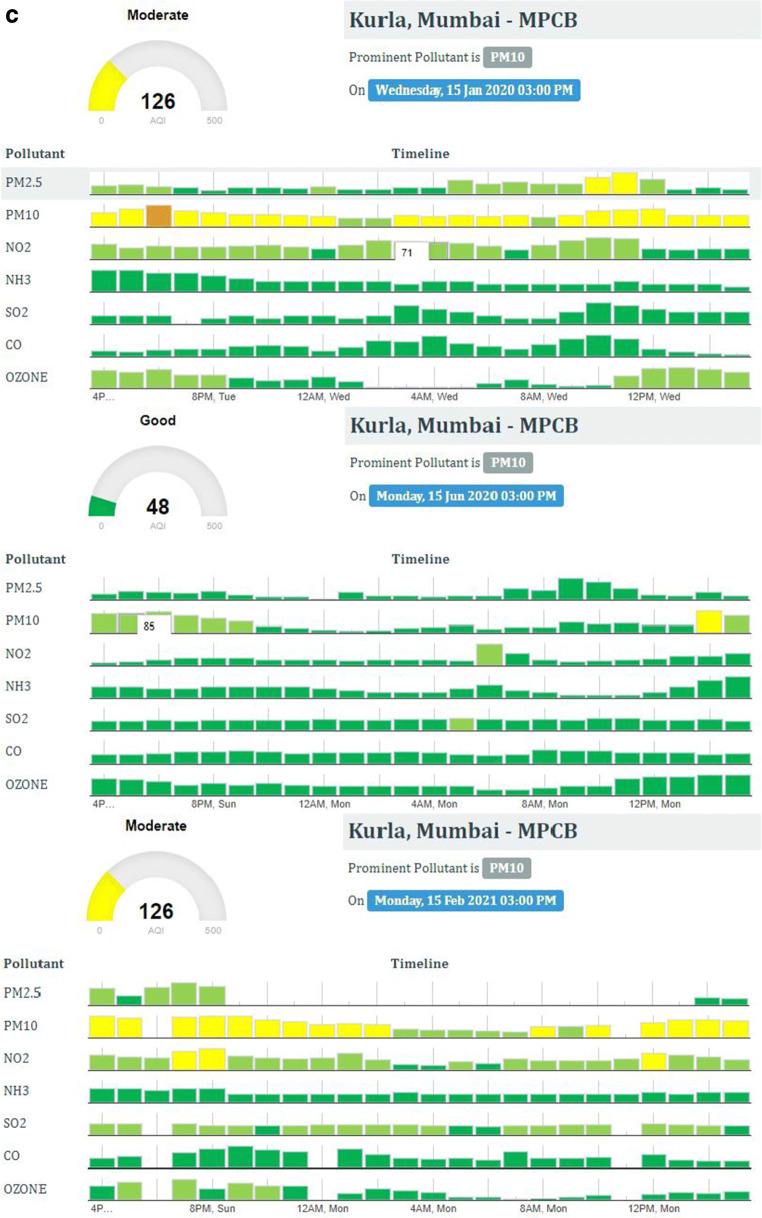
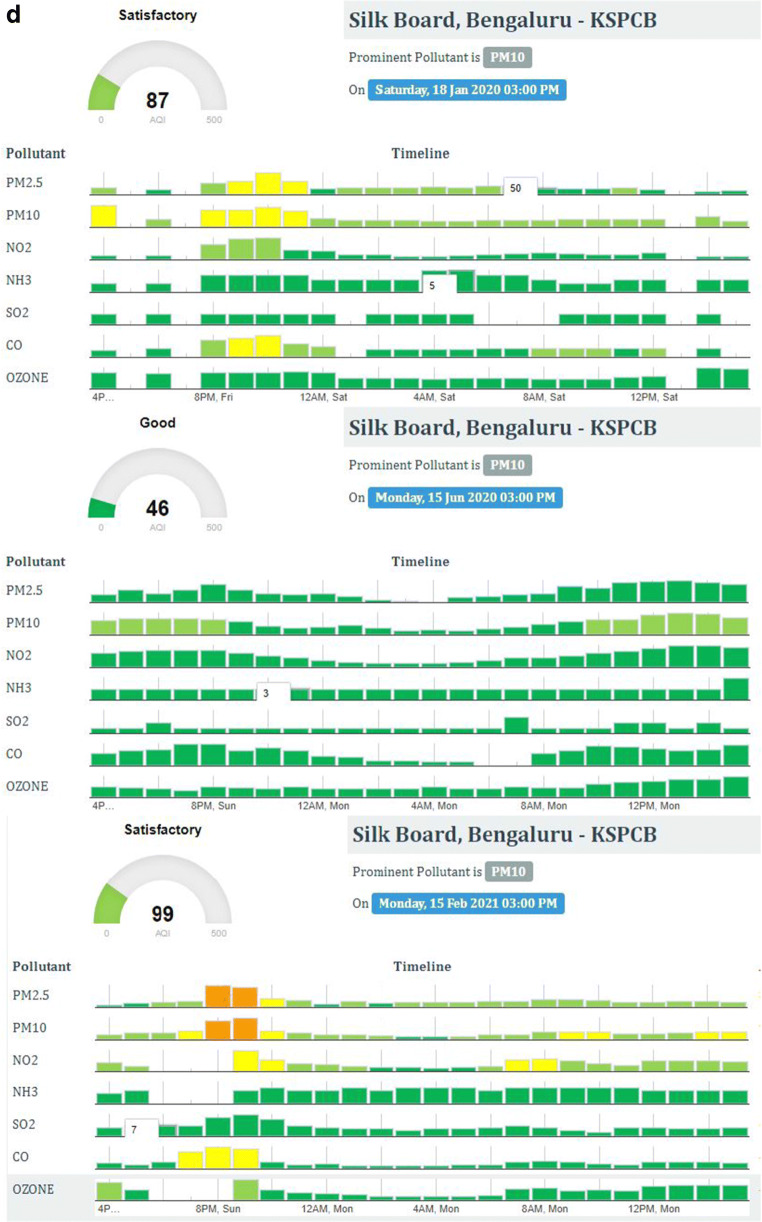
The COVID-19 pandemic has significantly affected economic activities all around the world. Though it took a huge amount of human breathes as well as increases unemployment, it puts a positive impression on the environment. To stop the speedy extend of this disease, the maximum Government has imposed a strict lockdown on their citizens which creates a constructive impact on the atmosphere. Air pollutant concentration has been investigated in this study to analyze the impact of lockdown on the environment. Based on the air pollutant concentration, Air Quality Index (AQI) is deliberated. The Air Quality Index indicates the most and least polluted cities in the world. A higher value of AQI represents the higher polluted city and a lesser value of Air Quality Index represents a less polluted city. The impact of lockdown on air quality has been studied in this work and it is observed that the air pollutant concentration has reduced in every city of the world during the lockdown period. It has been also detected that the PM2.5 and PM10 are the most affecting air concentrator which controls the air quality of all the selected places during and after lockdown.
Keywords: Air Quality Index (AQI); Carbon monoxide (CO); Ground-level ozone (O3); Nitrogen dioxide (NO2); Particle pollution; Sulphur dioxide (SO2).
© 2021. The Author(s), under exclusive licence to Springer-Verlag GmbH Germany, part of Springer Nature.
Conflict of interest statement
The authors declare no competing interests.
Figures
Similar articles
-
A global observational analysis to understand changes in air quality during exceptionally low anthropogenic emission conditions.Environ Int. 2021 Dec;157:106818. doi: 10.1016/j.envint.2021.106818. Epub 2021 Aug 20. Environ Int. 2021. PMID: 34425482
-
COVID-19 outbreak, lockdown, and air quality: fresh insights from New York City.Environ Sci Pollut Res Int. 2021 Aug;28(30):41149-41161. doi: 10.1007/s11356-021-13556-8. Epub 2021 Mar 29. Environ Sci Pollut Res Int. 2021. PMID: 33779900 Free PMC article.
-
Assessment of air pollution status during COVID-19 lockdown (March-May 2020) over Bangalore City in India.Environ Monit Assess. 2021 Jun 8;193(7):395. doi: 10.1007/s10661-021-09177-w. Environ Monit Assess. 2021. PMID: 34105059 Free PMC article.
-
Geospatial analysis of COVID-19 lockdown effects on air quality in the South and Southeast Asian region.Sci Total Environ. 2021 Feb 20;756:144009. doi: 10.1016/j.scitotenv.2020.144009. Epub 2020 Nov 21. Sci Total Environ. 2021. PMID: 33250248 Free PMC article.
-
COVID-19 lockdown and environmental pollution: an Indian multi-state investigation.Environ Monit Assess. 2022 Jan 3;194(2):49. doi: 10.1007/s10661-021-09693-9. Environ Monit Assess. 2022. PMID: 34978634 Free PMC article. Review.
Cited by
-
Machine Learning and Meteorological Normalization for Assessment of Particulate Matter Changes during the COVID-19 Lockdown in Zagreb, Croatia.Int J Environ Res Public Health. 2022 Jun 6;19(11):6937. doi: 10.3390/ijerph19116937. Int J Environ Res Public Health. 2022. PMID: 35682517 Free PMC article.
-
Synoptic analysis of the most durable pollution and clean waves during 2009-2019 in Tehran City (capital of Iran).Nat Hazards (Dordr). 2022;110(2):1247-1272. doi: 10.1007/s11069-021-04990-5. Epub 2021 Aug 20. Nat Hazards (Dordr). 2022. PMID: 34429567 Free PMC article.
-
An overview and thematic analysis of research on cities and the COVID-19 pandemic: Toward just, resilient, and sustainable urban planning and design.iScience. 2022 Nov 18;25(11):105297. doi: 10.1016/j.isci.2022.105297. Epub 2022 Oct 7. iScience. 2022. PMID: 36246575 Free PMC article.
-
Functional ANOVA approaches for detecting changes in air pollution during the COVID-19 pandemic.Stoch Environ Res Risk Assess. 2022;36(4):1083-1101. doi: 10.1007/s00477-021-02071-4. Epub 2021 Aug 24. Stoch Environ Res Risk Assess. 2022. PMID: 34456623 Free PMC article.
-
Change in the air due to the coronavirus outbreak in four major cities of India: What do the statistics say?J Hazard Mater Adv. 2023 May;10:100325. doi: 10.1016/j.hazadv.2023.100325. Epub 2023 May 29. J Hazard Mater Adv. 2023. PMID: 37274946 Free PMC article.
References
-
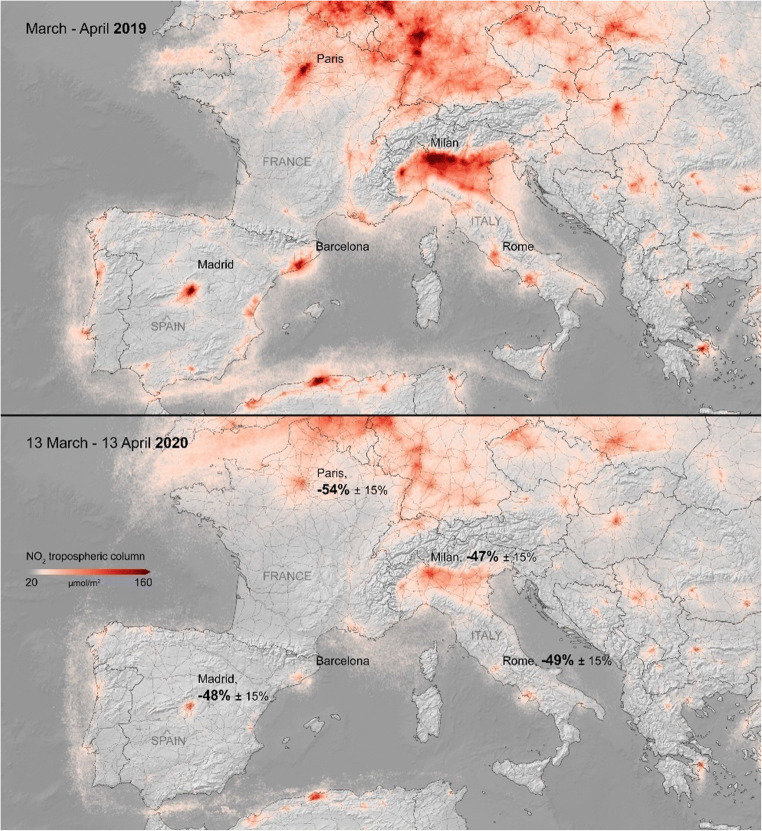
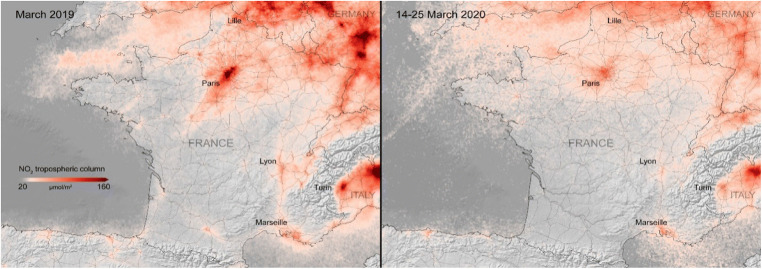
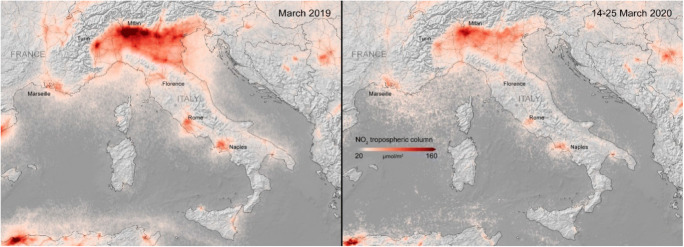
- Air pollution in a post-COVID-19 world 2020 Available: https://www.esa.int/ Applications/Observing_the_Earth/Copernicus/Sentinel-5P/Air_pollution_in_a_post-COVID-19_world
-
- Air pollution remains low as Europeans stay at home 2020 Available: https://www.esa.int/Applications/Observing_the_Earth/Copernicus/Sentinel... pollution _remains_low_ as_Europeans_stay_at_home
-
- Air pollution returning to pre-COVID levels 2020 Available: https://www.esa.int/ Applications/Observing_the_Earth/Copernicus/Sentinel-5P/Air_pollution_returning_to_pre-COVID_levels
-
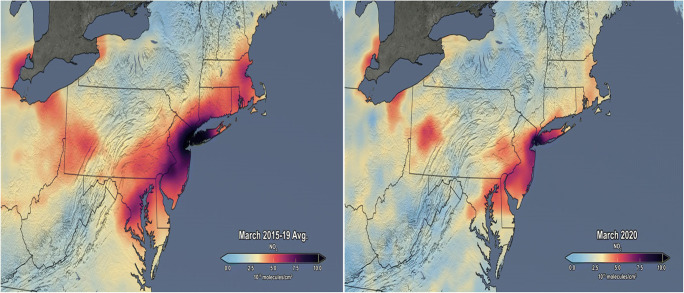
- Airborne Nitrogen Dioxide Plummets Over China 2020 Available: https://earthobservatory.nasa.gov/images/146362/airborne-nitrogen-dioxid...
Publication types
MeSH terms
Substances
LinkOut - more resources
Full Text Sources
Other Literature Sources
Medical
