A single setup approach for the MRI-based measurement and validation of the transfer function of elongated medical implants
- PMID: 34036617
- PMCID: PMC8596675
- DOI: 10.1002/mrm.28840
A single setup approach for the MRI-based measurement and validation of the transfer function of elongated medical implants
Abstract
Purpose: To propose a single setup using the MRI to both measure and validate the transfer function (TF) of linear implants. Conventionally, the TF of an implant is measured in one bench setup and validated using another.
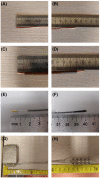
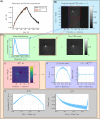
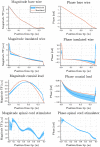
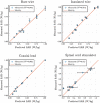
Methods: It has been shown that the TF can be measured using MRI. To validate this measurement, the implant is exposed to different incident electric fields, while the temperature increase at the tip is monitored. For a good validation, the incident electric fields that the implant is exposed to should be orthogonal. We perform a simulation study on six different methods that change the incident electric field. Afterward, a TF measurement and validation study using the best method from the simulations is performed. This is done with fiberoptic temperature probes at 1.5 T for four linear implant structures using the proposed single setup.
Results: The simulation study showed that positioning local transmit coils at different locations along the lead trajectory has a similar validation quality compared with changing the implant trajectory (ie, the conventional validation method). For the validation study that was performed, an R2 ≥ 0.91 was found for the four investigated leads.
Conclusion: A single setup to both measure and validate the transfer function using local transmit coils has been shown to work. The benefits of using the proposed validation method are that there is only one setup required instead of two and the implant trajectory is not varied; therefore, the relative distance between the leap tip and the temperature probe is constant.
Keywords: measurement; simulation; transfer function; validation.
© 2021 The Authors. Magnetic Resonance in Medicine published by Wiley Periodicals LLC on behalf of International Society for Magnetic Resonance in Medicine.
Conflict of interest statement
M. Arcan Ertutk is a full‐time employee of Medtronic.
Figures


Similar articles
-
MRI-based transfer function determination for the assessment of implant safety.Magn Reson Med. 2017 Dec;78(6):2449-2459. doi: 10.1002/mrm.26613. Epub 2017 Feb 5. Magn Reson Med. 2017. PMID: 28164362
-
MRI-based, wireless determination of the transfer function of a linear implant: Introduction of the transfer matrix.Magn Reson Med. 2018 Dec;80(6):2771-2784. doi: 10.1002/mrm.27218. Epub 2018 Apr 24. Magn Reson Med. 2018. PMID: 29687916 Free PMC article.
-
MRI-based transfer function determination through the transfer matrix by jointly fitting the incident and scattered field.Magn Reson Med. 2020 Mar;83(3):1081-1095. doi: 10.1002/mrm.27974. Epub 2019 Oct 21. Magn Reson Med. 2020. PMID: 31631400 Free PMC article.
-
Interaction of radio frequency electromagnetic fields and passive metallic implants--a brief review.Bioelectromagnetics. 2006 Sep;27(6):431-9. doi: 10.1002/bem.20224. Bioelectromagnetics. 2006. PMID: 16622865 Review.
-
[Safety of implants in high field and ultrahigh field MRI].Radiologe. 2019 Oct;59(10):898-905. doi: 10.1007/s00117-019-0556-z. Radiologe. 2019. PMID: 31172246 Review. German.
References
-
- Panych LP, Madore B. The physics of MRI safety. J Magn Reson Imaging. 2018;47:28‐43. - PubMed
-
- Rezai AR, Finelli D, Nyenhuis JA, et al. Neurostimulation systems for deep brain stimulation: in vitro evaluation of magnetic resonance imaging‐related heating at 1.5 Tesla. J Magn Reson Imaging. 2002;15:241‐250. - PubMed
-
- Henderson JM, Phillips M, Tkach J, et al. Permanent neurological deficit related to magnetic resonance imaging in a patient with implanted deep brain stimulation electrodes for Parkinson's disease: case report. Neurosurgery. 2005;57:E1063. - PubMed
-
- ISO TS 10974 . Assessment of the Safety of Magnetic Resonance Imaging for Patients with an Active Implantable Medical Device. Geneva, Switzerland: International Organization for Standardization; 2018. - PubMed
-
- Erhardt JB, Fuhrer E, Gruschke OG, et al. Should patients with brain implants undergo MRI? J Neural Eng. 2018;15:041002. - PubMed
MeSH terms
LinkOut - more resources
Full Text Sources
Other Literature Sources
Medical
Miscellaneous

