. 2021 Oct;86(4):2234-2249.
doi: 10.1002/mrm.28849. Epub 2021 May 25.

Sparse precontrast T1 mapping for high-resolution whole-brain DCE-MRI

Affiliations

Sparse precontrast T1 mapping for high-resolution whole-brain DCE-MRI

Zhibo Zhu et al. Magn Reson Med. 2021 Oct.

Abstract

Purpose: To develop and evaluate an efficient precontrast T1 mapping technique suitable for quantitative high-resolution whole-brain dynamic contrast-enhanced-magnetic resonance imaging (DCE-MRI).

Methods: Variable flip angle (VFA) T1 mapping was considered that provides 1 × 1 × 2 mm3 resolution to match a recent high-resolution whole-brain DCE-MRI protocol. Seven FAs were logarithmically spaced from 1.5° to 15°. T1 and M0 maps were estimated using model-based reconstruction. This approach was evaluated using an anatomically realistic brain tumor digital reference object (DRO) with noise-mimicking 3T neuroimaging and fully sampled data acquired from one healthy volunteer. Methods were also applied on fourfold prospectively undersampled VFA data from 13 patients with high-grade gliomas.

Results: T1 -mapping precision decreased with undersampling factor R, althoughwhereas bias remained small before a critical R. In the noiseless DRO, T1 bias was <25 ms in white matter (WM) and <11 ms in brain tumor (BT). T1 standard deviation (SD) was <119.5 ms in WM (coefficient of variation [COV] ~11.0%) and <253.2 ms in BT (COV ~12.7%). In the noisy DRO, T1 bias was <50 ms in WM and <30 ms in BT. For R ≤ 10, T1 SD was <107.1 ms in WM (COV ~9.9%) and <240.9 ms in BT (COV ~12.1%). In the healthy subject, T1 bias was <30 ms for R ≤ 16. At R = 4, T1 SD was 171.4 ms (COV ~13.0%). In the prospective brain tumor study, T1 values were consistent with literature values in WM and BT.

Conclusion: High-resolution whole-brain VFA T1 mapping is feasible with sparse sampling, supporting its use for quantitative DCE-MRI.

Keywords: T1 mapping; brain tumor; model-based reconstruction; quantitative dynamic contrast-enhanced-magnetic resonance imaging (DCE-MRI); sparse sampling.


Conflict of interest statement

Coauthor R. Marc Lebel is an employee of GE Healthcare. The authors declare that they have no competing interests.

Figures

FIGURE 1
FIGURE 1
Brain tumor digital reference object (DRO) results. A, T1 histograms for the noiseless DRO. B, T1 histograms for the 3T‐mimicking noisy DRO. C, T1 mean values. D, T1 standard deviation (Std) values. All are plotted as a function of (A,B,E,F) undersampling factor or (C,D,G,H) variable flip angle (VFA) scan time. VFA scan time axis is in logarithmic scale. The top row represents brain tumor (BT) region of interest (ROI), and the bottom row represents the white matter (WM) ROI. The red dot represents the reference T1 value in (A,B,E,F), and the undersampling level matching the prospective undersampling are marked bold in (C,D,G,H). As expected, precision gets monotonically worse with a higher undersampling factor. In the noiseless case, when R ≤ 16 (VFA scan time ≥137.63 s), the T1 bias is <1 ms and SD is <40 ms for both tissues. In the 3D‐mimicking case, when R ≤ 10, the T1 bias is <10 ms and SD is <110 ms (WM) and <250 ms (BT)
FIGURE 2
FIGURE 2
Healthy volunteer results. Fully sampled data sets were retrospectively undersampled with 10 realizations of the pseudorandom data sampling pattern. (A), White matter (WM) T1 histogram as a function of undersampling factor. (B), Mean T1. C, T1 standard deviation (Std) as a function of variable flip angle (VFA) scan time. VFA scan time axis is in logarithmic scale. The mean T1 from fully sampled data is shown as the blue dashed line in (B). Bias is insignificant (<30 ms) until R ≥ 16. Precision gets worse with a higher undersampling factor, but imprecision caused by this method is not detectable until R ≥ 10. When R ≤ 10 (VFA scan time ≥100.8 s), T1 mapping bias is <11 ms, and SD is <214 ms
FIGURE 3
FIGURE 3
Illustration of T1 spatial and absolute fractional difference maps from the healthy volunteer. Direct reconstruction of the fully sampled data is taken as the reference. Qualitatively, for R ≤ 10, we see minor error in white matter (WM) or gray matter (GM). Errors appear isolated to cerebrospinal fluid (bias > 1278.5 ms, standard deviation [SD] > 557.6 ms) and muscle (bias > 156.9 ms, SD > 209.8 ms), whose T1 values are generally less of interest in brain dynamic contrast‐enhanced–magnetic resonance imaging. Importantly, no spatial patterns indicating systemic errors were observed in the error maps. For R > 10, we observed severe error corruption of T1 maps in GM and WM regions
FIGURE 4
FIGURE 4
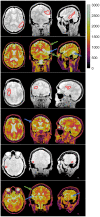
Representative M0 and T1 maps from three patients with high‐grade glioma. Maps are volumetric, and axial, coronal, and sagittal slices through the tumor section for each patient (the first, the third, and the fifth row). M0 maps with tumor region of interest drawn in red (the second, the fourth, and the sixth row). T1 maps showing good delineation of white matter (WM), gray matter (GM), cerebrospinal fluid, and tumor. WM and GM regions have the expected homogeneity. In addition to tissue differential, these maps also reveal the locations of craniotomy (green arrow) and postsurgical cavities (blue arrow) that are filled with proteinaceous fluid such as blood in high spatial resolution
FIGURE 5
FIGURE 5
Closeup of T1 maps from the three patients in Figure 4. Maps are zoomed into the tumor region (delineated by white dashed box in Figure 4), with narrow display range. The proposed method captures T1 heterogeneity. T1 coefficient of variation are 10.84%, 9.96%, and 7.31% for the top, middle, and bottom rows, respectively. All cases show spatial variations in T1. For example, T1 is longer in tumor center (eg, light green arrow) than in the tumor rim (eg, green arrow) and the peritumoral regions (eg, dark green arrow)
FIGURE A1
FIGURE A1
Error analysis in tracer‐kinetic (TK) estimation in the Patlak model. The first row shows partial derivatives of vp and Kt of precontrast T1 values (1700 ± 255 ms). The second row shows the first‐order error of vp and Kt as a function of ±255 ms (±15%) ΔT1. Parker’s (blue), Georgiou’s (red), and in vivo measured (yellow) vascular input functions (VIFs) were analyzed. As the first row shows, partial derivatives were positive and decreased as T1 increased. Consequently, errors in TK parameters were positively related to T1 errors, and T1 error propagation was slower when T1 increased. As the second row shows, a ±255 ms (±15%) ΔT1 results in ±0.0064, ±0.0043, and ±0.0085 errors in vp, and ±0.0074 min−1, ±0.0053 min−1, and ±0.0028 min−1 errors in Kt in Parker’s, Georgiou’s and in vivo measured VIF, respectively
FIGURE A2
FIGURE A2
Partial derivatives of vp and Kt of precontrast T1 values (1700 ± 255 ms) in the ETK model. The 1st row shows the 2D plot of partial derivatives of vp, and the 2nd row shows the 2D plot of partial derivatives of Kt as a function of both rate constant kep and T1. Like the Patlak model, both derivatives monotonically decreased as T1 increases, however, they are not monotonic functions of kep. Especially for the partial derivative of Kt, it had different polarities depending on kep value
FIGURE A3
FIGURE A3
The first‐order error in tracer‐kinetic (TK) parameters as a function of ΔT1 in the extended Tofts‐Kety (ETK) model. Errors are plotted for ±255 ms (±15%) ΔT1. The first and second row show the first‐order error of vp and Kt, respectively, and errors were analyzed using Parker’s (left), Georgiou’s (middle), and in vivo measured (right) vascular input function. Errors were also evaluated at three different kep values to show dependencies on kep. For vp, the result is similar to that in Patlak model, whereas it is noticeable that Δvp will be amplified at a higher kep region, for example, tumor. For Kt, the result is more complicated because of the derivative polarity change for different kep

Similar articles

References

    1. Tofts PS, Brix G, Buckley DL, et al. Estimating kinetic parameters from dynamic contrast‐enhanced t1‐weighted MRI of a diffusable tracer: standardized quantities and symbols. J Magn Reson Imaging. 1999;10:223‐232. - PubMed
    1. Sourbron SP, Buckley DL. On the scope and interpretation of the Tofts models for DCE‐MRI. Magn Reson Med. 2011;66:735‐745. - PubMed
    1. O’Connor JPB, Jackson A, Parker GJM, Roberts C, Jayson GC. Dynamic contrast‐enhanced MRI in clinical trials of antivascular therapies. Nat Rev Clin Oncol. 2012;9:167‐177. - PubMed
    1. Heye AK, Culling RD, Valdés Hernández MDC, Thrippleton MJ, Wardlaw JM. Assessment of blood‐brain barrier disruption using dynamic contrast‐enhanced MRI. A systematic review. NeuroImage Clin. 2014;6:262‐274. - PMC - PubMed
    1. Law M, Yang S, Babb JS, et al. Comparison of cerebral blood volume and vascular permeability from dynamic susceptibility contrast‐enhanced perfusion MR imaging with glioma grade. Am J Neuroradiol. 2004;25:746‐755. - PMC - PubMed

Publication types