. 2021 Jul 26;95(16):e0058821.
doi: 10.1128/JVI.00588-21. Epub 2021 Jul 26.

An Amino Acid Polymorphism within the HIV-1 Nef Dileucine Motif Functionally Uncouples Cell Surface CD4 and SERINC5 Downregulation

Affiliations

An Amino Acid Polymorphism within the HIV-1 Nef Dileucine Motif Functionally Uncouples Cell Surface CD4 and SERINC5 Downregulation

Mitchell J Mumby et al. J Virol. .

Abstract

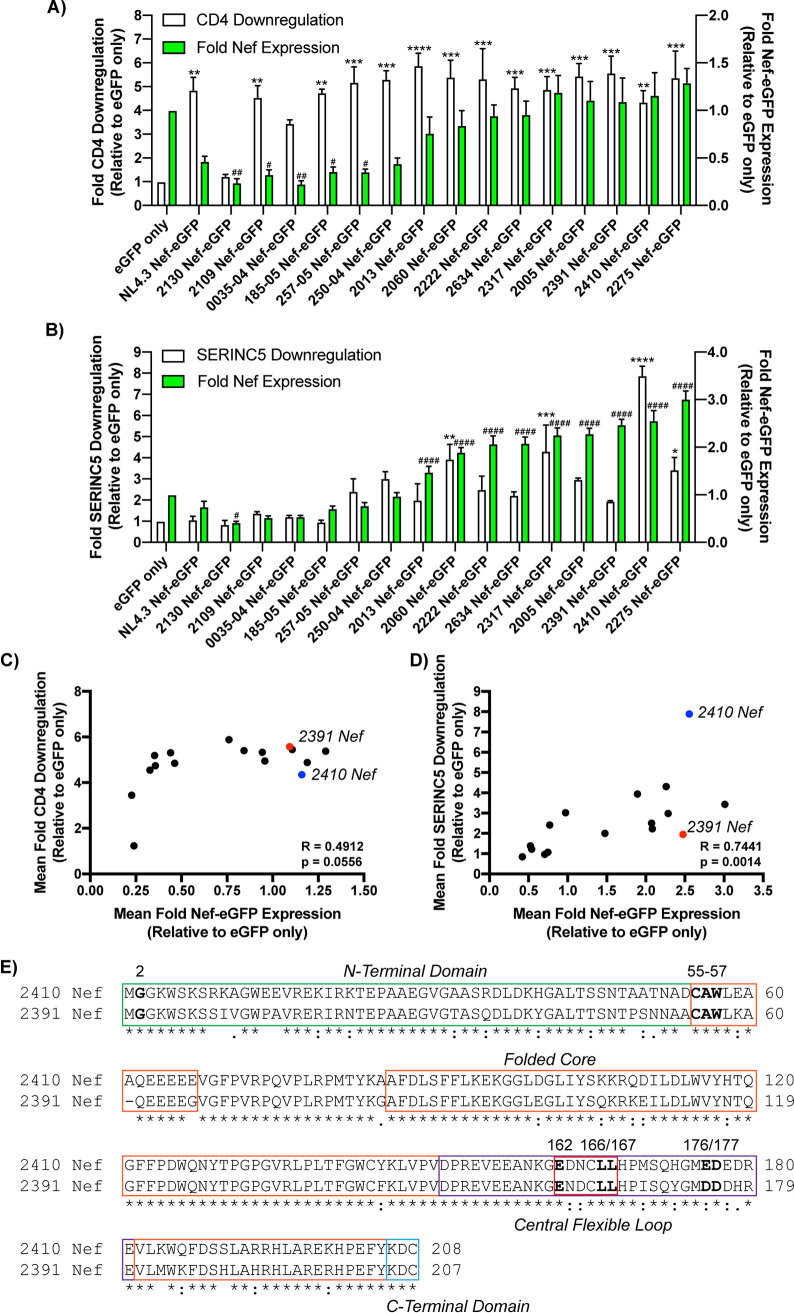
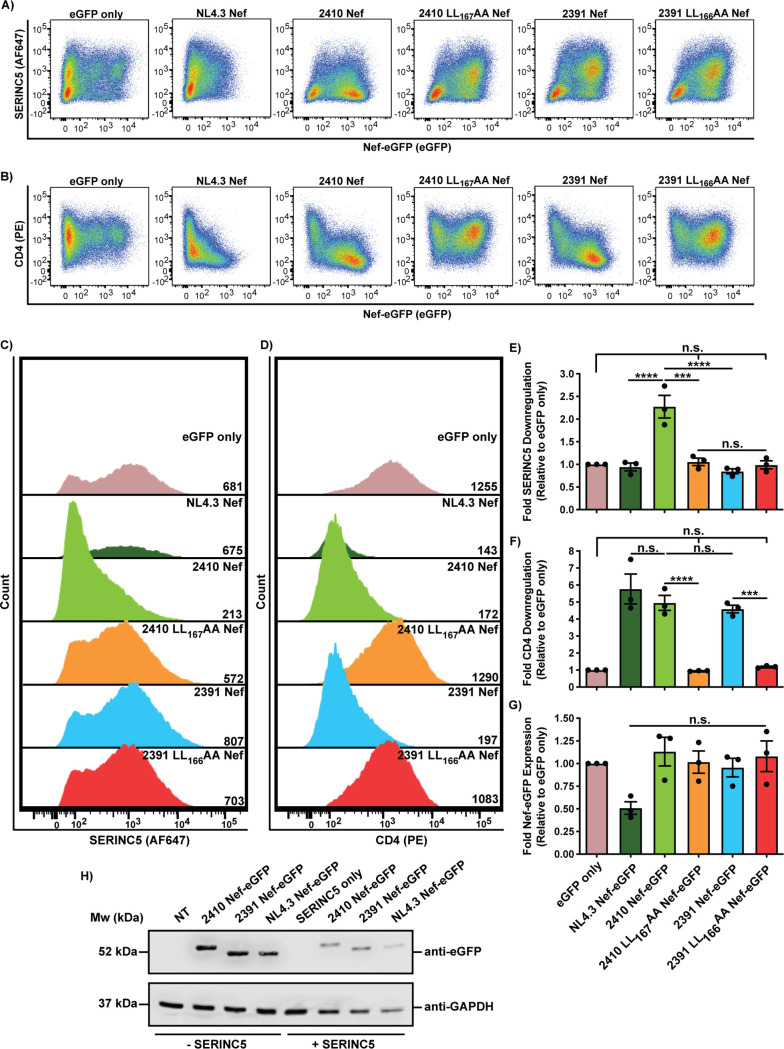
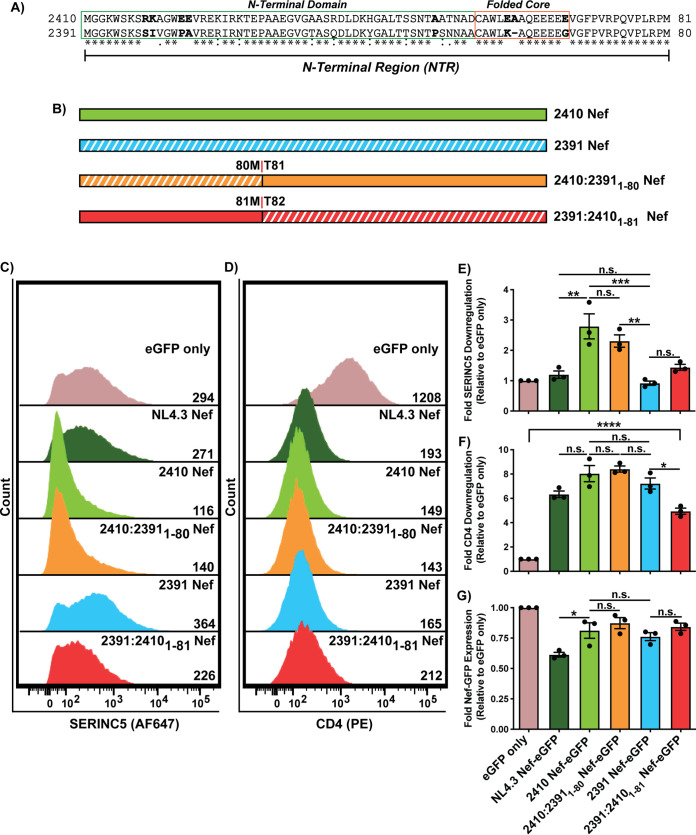
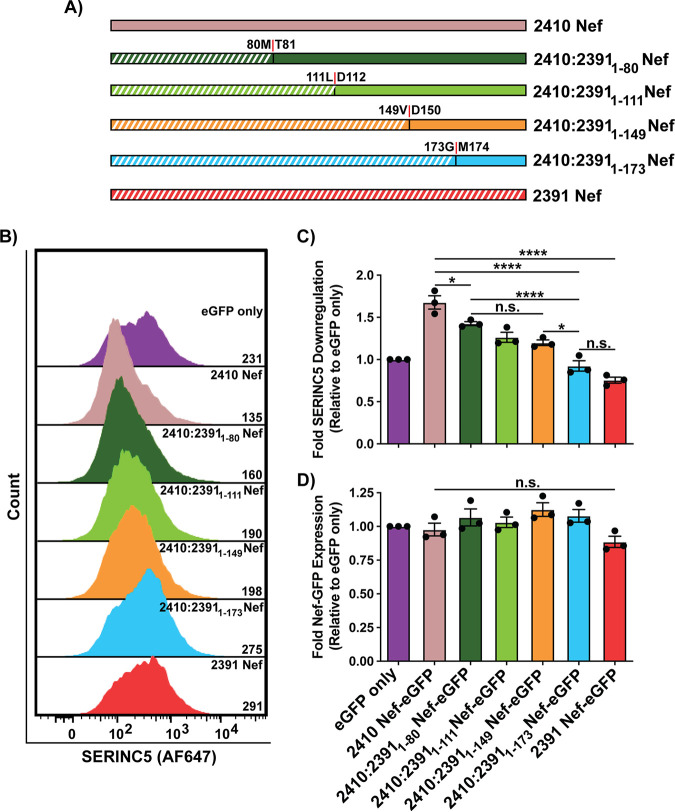
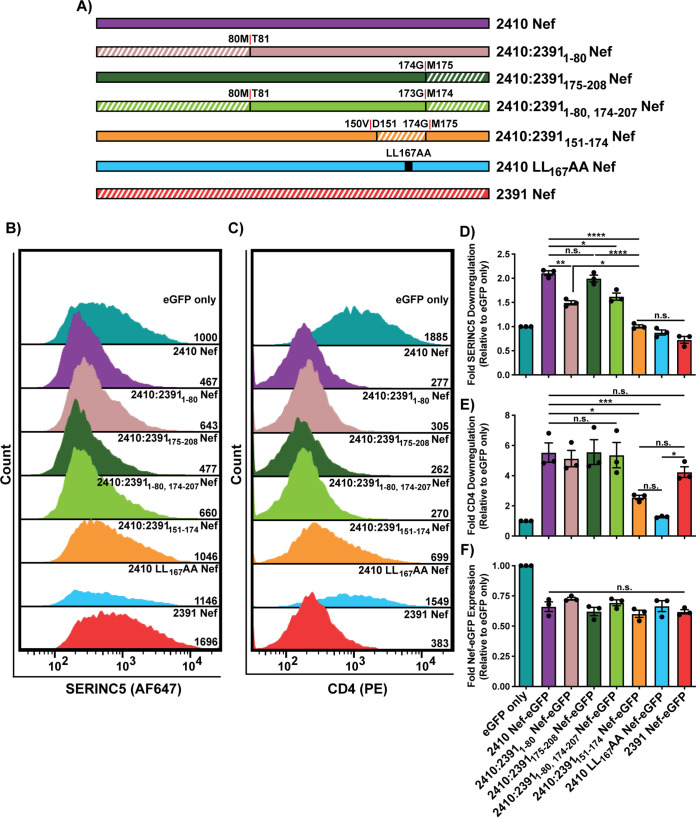
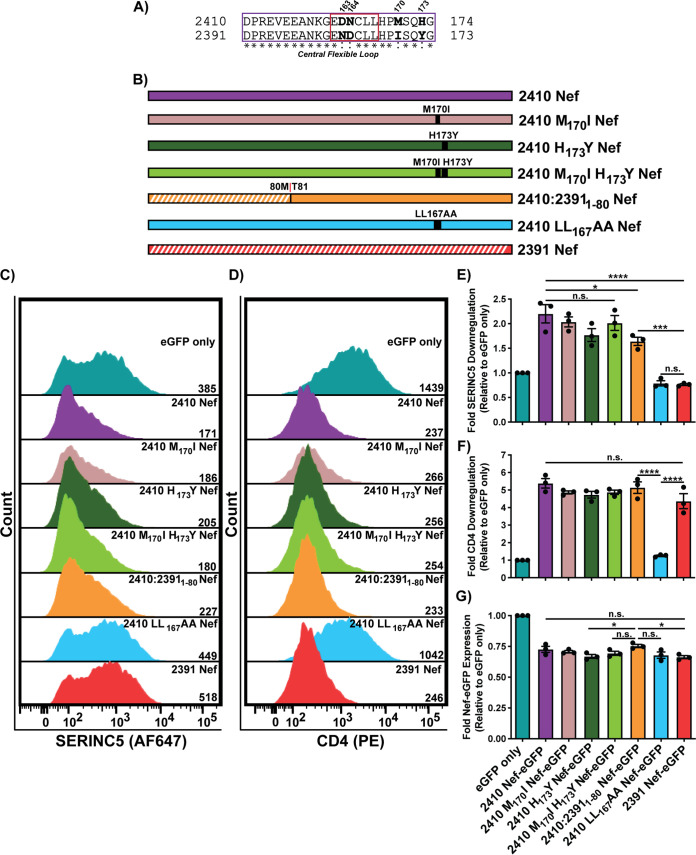
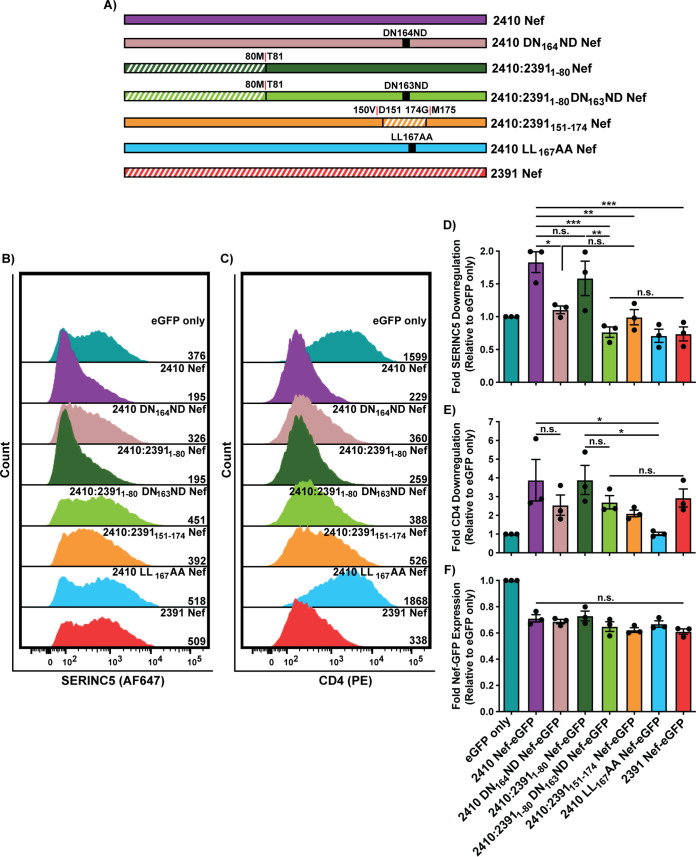
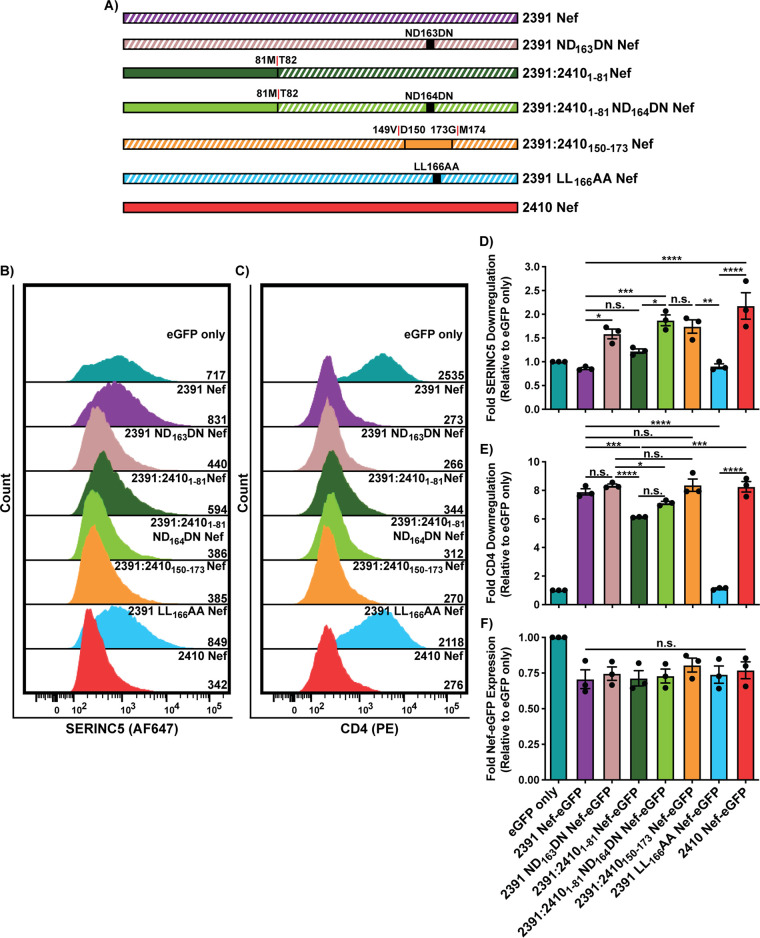
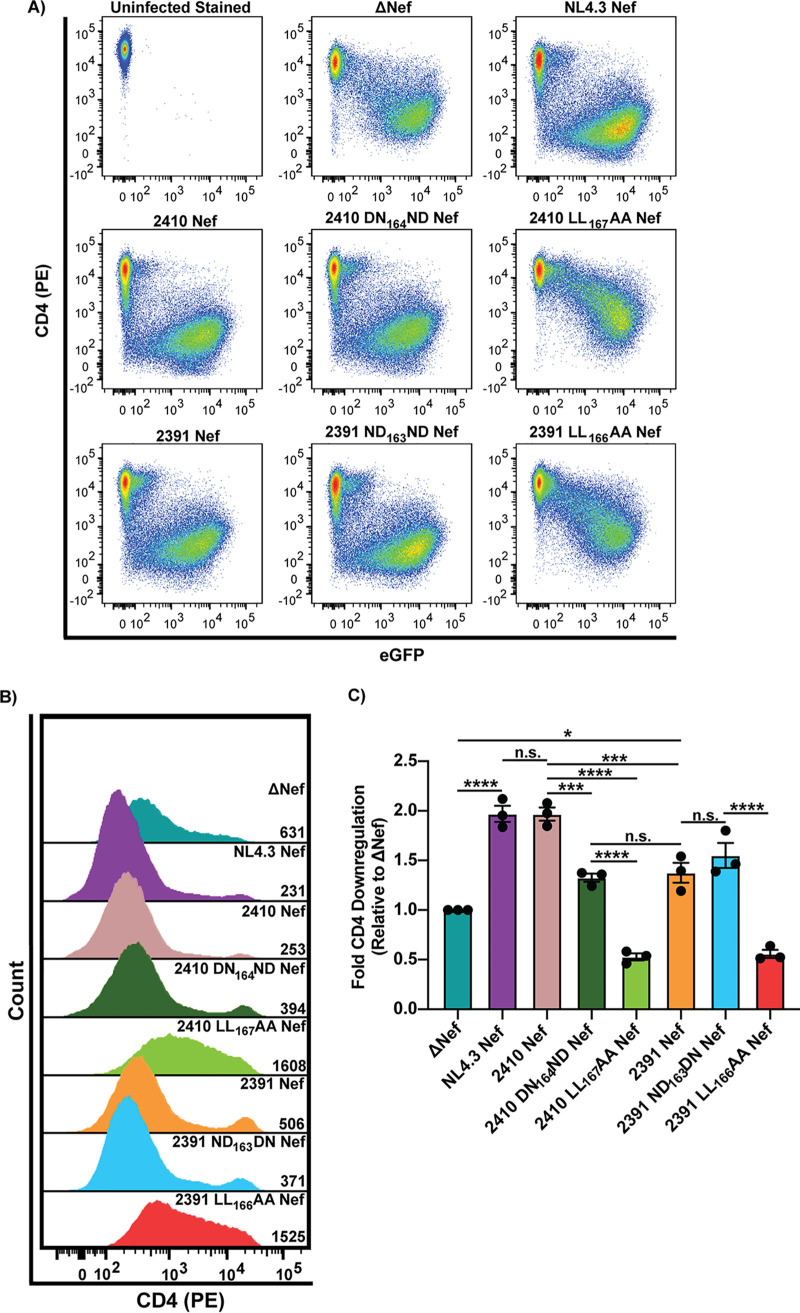
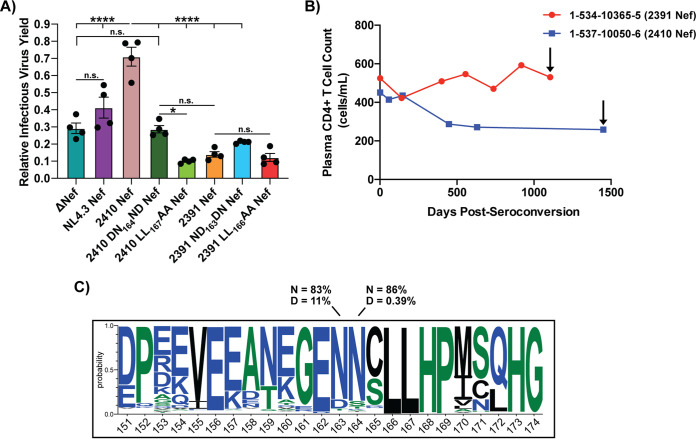
Serine incorporator 5 (SERINC5) reduces the infectivity of progeny HIV-1 virions by incorporating into the outer host-derived viral membrane during egress. To counter SERINC5, the HIV-1 accessory protein Nef triggers SERINC5 internalization by engaging the adaptor protein 2 (AP-2) complex using the [D/E]xxxL[L/I]167 Nef dileucine motif. Nef also engages AP-2 via its dileucine motif to downregulate the CD4 receptor. Although these two Nef functions are related, the mechanisms governing SERINC5 downregulation are incompletely understood. Here, we demonstrate that two primary Nef isolates, referred to as 2410 and 2391 Nef, acquired from acutely HIV-1 infected women from Zimbabwe, both downregulate CD4 from the cell surface. However, only 2410 Nef retains the ability to downregulate cell surface SERINC5. Using a series of Nef chimeras, we mapped the region of 2391 Nef responsible for the functional uncoupling of these two antagonistic pathways to the dileucine motif. Modifications of the first and second x positions of the 2410 Nef dileucine motif to asparagine and aspartic acid residues, respectively (ND164), impaired cell surface SERINC5 downregulation, which resulted in reduced infectious virus yield in the presence of SERINC5. The ND164 mutation additionally partially impaired, but did not completely abrogate, Nef-mediated cell surface CD4 downregulation. Furthermore, the patient infected with HIV-1 encoding 2391 Nef had stable CD4+ T cell counts, whereas infection with HIV-1 encoding 2410 Nef resulted in CD4+ T cell decline and disease progression. IMPORTANCE A contributing factor to HIV-1 persistence is evasion of the host immune response. HIV-1 uses the Nef accessory protein to evade the antiviral roles of the adaptive and intrinsic innate immune responses. Nef targets SERINC5, a restriction factor which potently impairs HIV-1 infection by triggering SERINC5 removal from the cell surface. The molecular determinants underlying this Nef function remain incompletely understood. Recent studies have found a correlation between the extent of Nef-mediated SERINC5 downregulation and the rate of disease progression. Furthermore, single-residue polymorphisms outside the known Nef functional motifs can modulate SERINC5 downregulation. The identification of a naturally occurring Nef polymorphism impairing SERINC5 downregulation in this study supports a link between Nef downregulation of SERINC5 and the rate of plasma CD4+ T cell decline. Moreover, the observed functional impairments of this polymorphism could provide clues to further elucidate unknown aspects of the SERINC5 antagonistic pathway via Nef.

Keywords: CD4; HIV; Nef; SERINC5; infectivity; membrane trafficking.


Figures

FIG 1
FIG 1
Primary Nef isolates displayed diverging Nef functionality. (A) CD4+ HeLa cells expressing Nef isolates were stained for cell surface CD4 and analyzed by flow cytometry. Shown is a summary of the fold CD4 downregulation ability (±SE) on the left y axis and fold Nef expression (±SE) on the right y axis for each Nef isolate (n = 3). (B) CD4+ HeLa cells coexpressing each Nef isolate and SERINC5.intHA were stained for cell surface SERINC5 and analyzed by flow cytometry. Shown is a summary of the fold SERINC5 downregulation ability (±SE) on the left y axis, and fold Nef-expression (±SE) on the right y axis for each Nef isolate (n = 3). Significance of Nef-eGFP expression and CD4/SERINC5 cell surface downregulation are denoted by # and ∗, respectively, upon comparison to the eGFP only control. Correlation analysis between the mean fold Nef-eGFP expression (x axis) and mean fold CD4 downregulation (C) and mean fold SERINC5 downregulation (y axis) (D) are shown for the 15 described primary Nef isolates and NL4.3 Nef. The blue and red dots indicate the 2410 Nef-eGFP and 2391 Nef-eGFP samples, respectively. Statistical analysis was conducted using the Spearman rank correlation test. (E) Amino acid sequence alignment of 2410 and 2391 Nef. Boldfaced Nef residues denote shared residues/motifs involved in Nef-mediated CD4 downregulation or enhancing virion infectivity in the presence of SERINC5. The location of the specific Nef domains, including the N-terminal domain (green), folded core (orange), central flexible loop (purple), Nef dileucine motif (red), and the C-terminal domain (blue), are highlighted in the appropriate boxes. An asterisk indicates positions with a fully conserved residue between the isolates. A colon indicates conservation of residues with similar properties (scoring >0.5 in the Gonnet PAM 250 matrix). A period indicates conservation of residues with less similar properties (scoring ≤0.5 and >0 in the Gonnet PAM 250 matrix). eGFP, enhanced green fluorescent protein; SE, standard error; *, P ≤ 0.05; **, P ≤ 0.01; ***, P ≤ 0.001; ****, P ≤ 0.0001; #, P ≤ 0.05; ##, P ≤ 0.01; ####, P ≤ 0.0001.
FIG 2
FIG 2
Nef isolates 2410 and 2391 both downregulate cell surface CD4 but differentially downregulate cell surface SERINC5. CD4+ HeLa cells expressing 2410 or 2391 Nef-eGFP and SERINC5.intHA were stained for cell surface CD4 and SERINC5 and analyzed by flow cytometry. CD4+ HeLa cell populations were determined by gating on eGFP+ cells using an FMO control. (A and B) Representative pseudocolor plots illustrating cell surface SERINC5 (Alexa Fluor 647) (A) and cell surface CD4 (PE) (B) levels of Nef+ cell populations (eGFP+). (C and D) Representative histograms illustrating cell surface SERINC5 (C) or CD4 (D) levels on CD4+ HeLa cells after gating on single and Nef+ (eGFP+) cells. Geometric mean fluorescence intensities (MFIs) of the cell surface proteins are indicated. (E to G) Summary of the fold downregulation ability (±SE) for cell surface SERINC5 (E), cell surface CD4 (F), and fold Nef-eGFP (G) expression (n = 3). (H) Western blot illustrating the expression of Nef-eGFP fusion proteins in the absence and presence of SERINC5 in CD4+ HeLa cells. eGFP, enhanced green fluorescent protein; AF647, Alexa Fluor 647; PE, phycoerythrin; SE, standard error; Mw, molecular weight; kDa, kilodaltons; NT, nontransfected; GAPDH, glyceraldehyde 3-phosphate dehydrogenase; ***, P ≤ 0.001; ****, P ≤ 0.0001; n.s., nonsignificant (P > 0.05).
FIG 3
FIG 3
Polymorphisms within the N-terminal domain of 2391 Nef do not impair its ability to downregulate cell surface SERINC5. CD4+ HeLa cells expressing 2410 and 2391 Nef or N-terminal Nef chimeras with SERINC5.intHA were stained for cell surface CD4 and SERINC5 and analyzed by flow cytometry. Nef+ CD4+ HeLa cells were determined by gating on eGFP+ cells using an FMO control. (A) Amino acid sequence alignment comparing the N-terminal region (residues 1 to 81; numbering based on the 2410 Nef sequence) of isolate 2410 and 2391 Nef. Boldfaced residues indicate polymorphisms of interest within the N-terminal region. The N-terminal domain and folded core region are denoted in green and orange boxes, respectively. (B) Schematic illustrating the Nef isolates and N-terminal Nef chimeras. The chimera breakpoint for each isolate is indicated. Subscripted residues indicate swapping with the other Nef isolate at the corresponding position. Regions belonging to 2391 Nef are indicated with white diagonal stripes, while regions belonging to 2410 Nef are indicated with solid colors. (C and D) Representative histograms illustrating cell surface SERINC5 (C) or CD4 levels (D) on CD4+ HeLa cells after gating on single and transfected (eGFP+) cells. Geometric mean fluorescence intensities (MFIs) of the respective cell surface proteins are indicated. (E to G) Summary of the fold-downregulation ability (±SE) for cell surface SERINC5 (E), cell surface CD4 (F), and fold Nef-eGFP (G) expression for each Nef isolate (n = 3). eGFP, enhanced green fluorescent protein; AF647, Alexa Fluor 647; PE, phycoerythrin; *, P ≤ 0.05; **, P ≤ 0.01; ***, P ≤ 0.001; n.s., nonsignificant (P > 0.05).
FIG 4
FIG 4
C-terminal region of 2391 Nef mediates severe impairments in downregulating cell surface SERINC5. CD4+ HeLa cells expressing various 2410 and 2391 Nefs with SERINC5.intHA were stained for cell surface SERINC5 and analyzed by flow cytometry. Nef+ CD4+ HeLa cells were determined by gating on eGFP+ cells using an FMO control. (A) Schematic illustrating Nef isolates and C-terminal 2410 Nef chimeras. Chimera break points for each isolate are indicated. Regions belonging to 2391 Nef are indicated with white diagonal stripes, while regions belonging to 2410 Nef are indicated with solid colors. (B) Representative histogram illustrating the cell surface SERINC5 levels on CD4+ HeLa cells after gating on single and transfected (eGFP+) cells. Geometric mean fluorescence intensities (MFIs) of cell surface SERINC5 are indicated. (C) Summary of the fold downregulation ability (±SE) for cell surface SERINC5. (D) Fold Nef-eGFP expression for each Nef isolate (n = 3). eGFP, enhanced green fluorescent protein; AF647, Alexa Fluor 647; SE, standard error; *, P ≤ 0.05; ****, P ≤ 0.0001; n.s., nonsignificant (P > 0.05).
FIG 5
FIG 5
C-terminal region mediating SERINC5 downregulation impairments is located between residues 151 and 174. CD4+ HeLa cells expressing 2410 and 2391 Nef as well as Nef chimeras in which residues 151 to 174 and residues 175 to 208 of 2410 Nef were replaced with the corresponding region of 2391 Nef (2410:2391151-174 Nef and 2410:2391175-208 Nef, respectively) and with SERINC5.intHA were stained for cell surface CD4 and SERINC5 and analyzed by flow cytometry. Nef+ CD4+ HeLa cells were determined by gating on eGFP+ cells using an FMO control. (A) Schematic illustrating Nef isolates and 2410 Nef chimeras. Chimera break points for each isolate are indicated. Regions belonging to 2391 Nef are indicated with white diagonal stripes, while regions belonging to 2410 Nef are indicated with solid colors. (B and C) Representative histograms illustrating cell surface SERINC5 (B) or CD4 (C) levels on CD4+ HeLa cells after gating on single and transfected (eGFP+) cells. Geometric mean fluorescence intensities (MFIs) of the respective cell surface proteins are indicated. (D to F) Summary of the fold downregulation ability (±SE) for cell surface SERINC5 (D), cell surface CD4 (E), and fold Nef-eGFP (F) expression for each Nef isolate (n = 3). eGFP, enhanced green fluorescent protein; AF647, Alexa Fluor 647; PE, phycoerythrin; SE, standard error; *, P ≤ 0.05; **, P ≤ 0.01; ***, P ≤ 0.001; ****, P ≤ 0.0001; n.s., nonsignificant (P > 0.05).
FIG 6
FIG 6
Mutations of 2410 Nef M170 or H173 do not impact SERINC5 downregulation. CD4+ HeLa cells expressing 2410 and 2391 Nef as well as the respective 2410 Nef mutants with SERINC5.intHA were stained for cell surface CD4 and SERINC5 and analyzed by flow cytometry. Nef+-transfected CD4+ HeLa cells were determined by gating on eGFP+ cells using an unstained control. (A) Amino acid sequence alignment comparing residues 151 to 174 of 2410 and 2391 Nef. Boldfaced residues indicate polymorphisms between the two Nef isolates within this region. The central flexible loop and Nef dileucine motif are denoted by purple and red boxes, respectively. (B) Schematic illustrating the Nef isolates and 2410 Nef chimeras/mutants utilized. Chimera break points for each isolate are indicated accordingly. Regions belonging to 2391 Nef are indicated with white diagonal stripes, while regions belonging to 2410 Nef are indicated with solid colors. (C and D) Representative histograms illustrating cell surface SERINC5 (C) and CD4 (D) levels on CD4+ HeLa cells after gating on single and transfected (eGFP+) cells. Geometric mean fluorescence intensities (MFIs) of the respective cell surface proteins are indicated. (E to G) Summary of the fold downregulation ability (±SE) for cell surface SERINC5 (E), cell surface CD4 (F), and fold Nef-eGFP (G) expression for each Nef isolate (n = 3). eGFP, enhanced green fluorescent protein; AF647, Alexa Fluor 647; PE, phycoerythrin; SE, standard error; *, P ≤ 0.05; ***, P ≤ 0.001; ****, P ≤ 0.0001; n.s., nonsignificant (P > 0.05).
FIG 7
FIG 7
Mutations of 2410 Nef residues D163 and N164 (DN164) severely impairs SERINC5 downregulation. CD4+ HeLa cells expressing 2410 and 2391 as well as mutants with SERINC5.intHA were stained for cell surface SERINC5 and CD4 and analyzed by flow cytometry. Single transfected CD4+ HeLa cells were determined by gating on eGFP+ cells using an unstained control. (A) Schematic of Nef isolates and chimeras/mutants utilized. The chimera break points for the respective chimera isolates are indicated. Regions belonging to 2391 Nef are indicated with white diagonal stripes, while regions belonging to 2410 Nef are indicated with solid colors. (B and C) Representative histograms illustrating cell surface (B) SERINC5 or (C) CD4 levels on CD4+ HeLa cells after gating on single and transfected (eGFP+) cells. Geometric mean fluorescence intensities (MFIs) of the respective cell surface proteins are indicated. (D to F) Summary of the fold downregulation ability (±SE) for (D) cell surface SERINC5, (E) cell surface CD4, and (F) fold Nef-eGFP expression for each Nef isolate (n = 3). eGFP, enhanced green fluorescent protein; AF647, Alexa Fluor 647; PE, phycoerythrin; SE, standard error; *, P ≤ 0.05; **, P ≤ 0.01; ***, P ≤ 0.001; n.s., nonsignificant (P > 0.05).
FIG 8
FIG 8
Reversing the polymorphism in 2391 Nef (ND163) rescues the ability of 2391 Nef to downregulate cell surface SERINC5. CD4+ HeLa cells expressing 2410 and 2391 Nef as well as 2391 Nef mutants with SERINC5.intHA. were stained for cell surface SERINC5 and CD4 and analyzed by flow cytometry. Nef+ CD4+ HeLa cells were determined by gating on eGFP+ cells using an unstained control. (A) Schematic of the Nef isolates and associated mutants/chimeras utilized. The chimera break points for the Nef chimeras are indicated. Regions belonging to 2391 Nef are indicated with white diagonal stripes, while regions belonging to 2410 Nef are indicated with solid colors. (B and C) Representative histograms illustrating cell surface (B) SERINC5 or (C) CD4 levels of CD4+ HeLa cells after gating on single and transfected (eGFP+) cells. Geometric mean fluorescence intensities (MFIs) of the respective cell surface proteins are indicated. (D to F) Summary of the fold downregulation ability (±SE) for (D) cell surface SERINC5, (E) cell surface CD4, and (F) fold Nef-eGFP expression for each Nef isolate (n = 3). eGFP, enhanced green fluorescent protein; AF647, Alexa Fluor 647; PE, phycoerythrin; SE, standard error; *, P ≤ 0.05; **, P ≤ 0.01; ***, P ≤ 0.001; ****, P ≤ 0.0001; n.s., nonsignificant (P > 0.05).
FIG 9
FIG 9
ND164 polymorphism impairs the ability of 2410 Nef to downregulate cell surface CD4 within infected cells. Sup-T1 cells were infected with VSV-G pseudotyped virions encoding the respective Nef proteins. The 2410 DN164ND and 2391 ND163DN mutants were included in these experiments. Infected cells were stained for cell surface CD4 and analyzed by flow cytometry. Live infected Sup-T1 cells were analyzed by gating on Zombie NIR using the Zombie FMO control, and then infected (eGFP+) cells were determined using an eGFP FMO control. (A) Representative pseudocolor plots illustrating cell surface CD4 (PE) and infection (eGFP+) of live (Zombie NIR) Sup-T1 cells. (B) Representative histograms illustrating cell surface levels of CD4 (PE) on Sup-T1 cells after gating on live (Zombie NIR) and infected (eGFP+) cells. CD4 (PE) geometric mean fluorescence intensities (MFIs) are indicated. (C) Summary of the fold-downregulation ability (±SE) of cell surface CD4 for each Nef isolate (n = 3). Fold downregulation of cell surface CD4 was calculated by comparing the geometric MFI of cell surface CD4 in live cells infected with the ΔNef negative control to cells infected with pseudoviruses encoding the respective Nef proteins. Zombie NIR, Zombie near-infrared; FMO, fluorescence minus one; eGFP, enhanced green fluorescent protein; PE, phycoerythrin; SE, standard error; *, P ≤ 0.05; ***, P ≤ 0.001; ****, P ≤ 0.0001; n.s., nonsignificant (P > 0.05).
FIG 10
FIG 10
ND164 polymorphism impairs the enhancement of infectious virus yield in the presence of SERINC5. (A) Virions encoding the respective Nef proteins were generated in the presence of SERINC5.intHA or an empty pBJ5 vector. Along with the primary Nef isolates, the 2410 DN164ND and 2391 ND163DN Nef mutants were included. TZM-bl cells were infected and relative infectious virus yield was determined by comparing the average relative luciferase units (RLUs) in the presence of SERINC5 to the absence of SERINC5. Results were obtained from four independent experiments (n = 4). (B) The patient from which 2391 Nef was derived (red) experienced a slower loss of plasma CD4+ T cells than the patient from which 2410 Nef was derived (blue). Black arrows indicate when the patients were placed on combined antiretroviral therapy (cART). (C) Amino acid frequencies of Nef residues 151 to 174, based on 7475 Nef sequences obtained from the Los Alamos HIV sequence database, are shown. Numbering is based on the 2410 Nef sequence. Listed percentages indicate the conservation of N (asparagine) or D (aspartic acid) at the indicated positions of Nef. *, P ≤ 0.05; ****, P ≤ 0.0001; n.s., nonsignificant (P > 0.05).

Similar articles

Cited by

References

    1. Cruz NVG, Amorim R, Oliveira FE, Speranza FAC, Costa LJ. 2013. Mutations in the nef and vif genes associated with progression to AIDS in elite controller and slow-progressor patients. J Med Virol 85:563–574. 10.1002/jmv.23512. - DOI - PubMed
    1. Kirchhoff F, Greenough TC, Brettler DB, Sullivan JL, Desrosiers RC. 1995. Absence of intact nef sequences in a long-term survivor with nonprogressive HIV-1 infection. N Engl J Med 332:228–232. 10.1056/NEJM199501263320405. - DOI - PubMed
    1. Rosa A, Chande A, Ziglio S, De Sanctis V, Bertorelli R, Goh SL, McCauley SM, Nowosielska A, Antonarakis SE, Luban J, Santoni FA, Pizzato M. 2015. HIV-1 Nef promotes infection by excluding SERINC5 from virion incorporation. Nature 526:212–217. 10.1038/nature15399. - DOI - PMC - PubMed
    1. Usami Y, Wu Y, Göttlinger HG. 2015. SERINC3 and SERINC5 restrict HIV-1 infectivity and are counteracted by Nef. Nature 526:218–223. 10.1038/nature15400. - DOI - PMC - PubMed
    1. Inuzuka M, Hayakawa M, Ingi T. 2005. Serine, an activity-regulated protein family, incorporates serine into membrane lipid synthesis. J Biol Chem 280:35776–35783. 10.1074/jbc.M505712200. - DOI - PubMed

Publication types

Substances