. 2021 Aug 2;220(8):e202009092.
doi: 10.1083/jcb.202009092. Epub 2021 May 26.

SAMM50 acts with p62 in piecemeal basal- and OXPHOS-induced mitophagy of SAM and MICOS components

Affiliations

SAMM50 acts with p62 in piecemeal basal- and OXPHOS-induced mitophagy of SAM and MICOS components

Yakubu Princely Abudu et al. J Cell Biol. .

Abstract

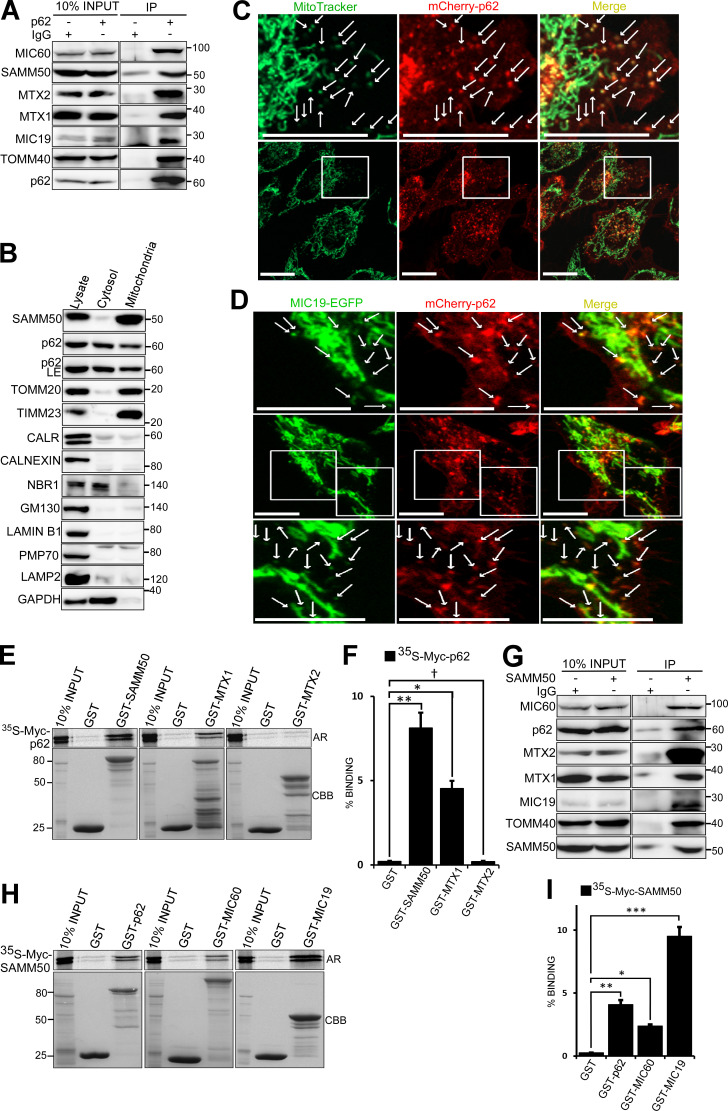
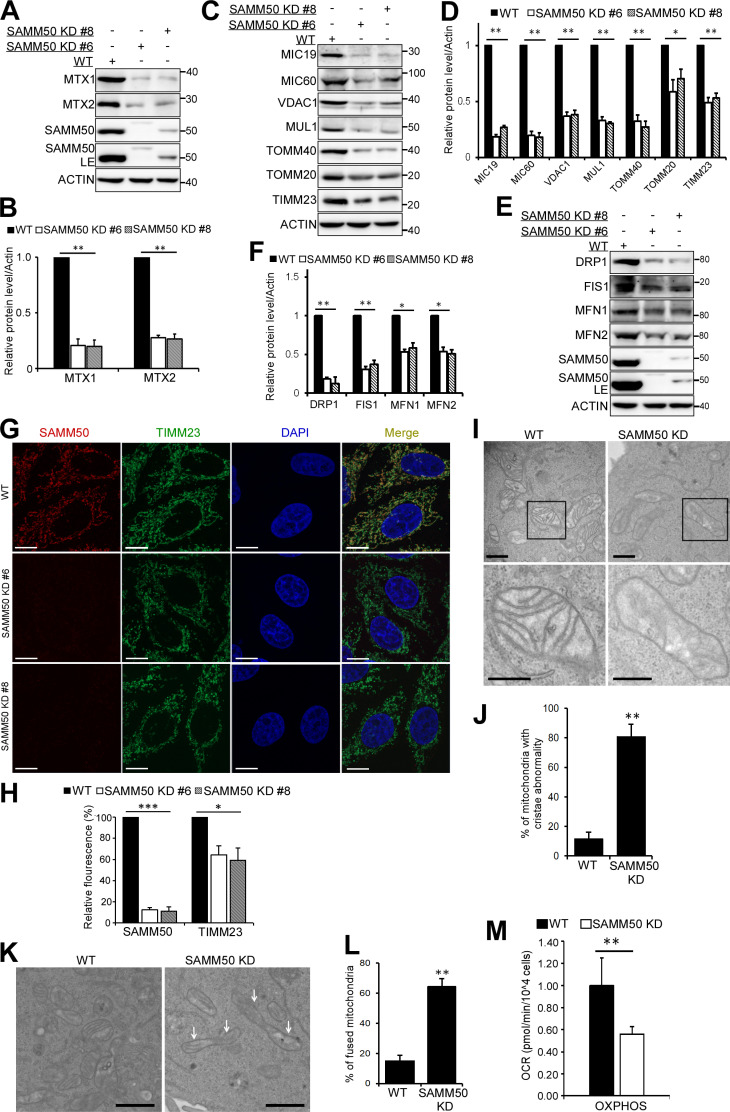
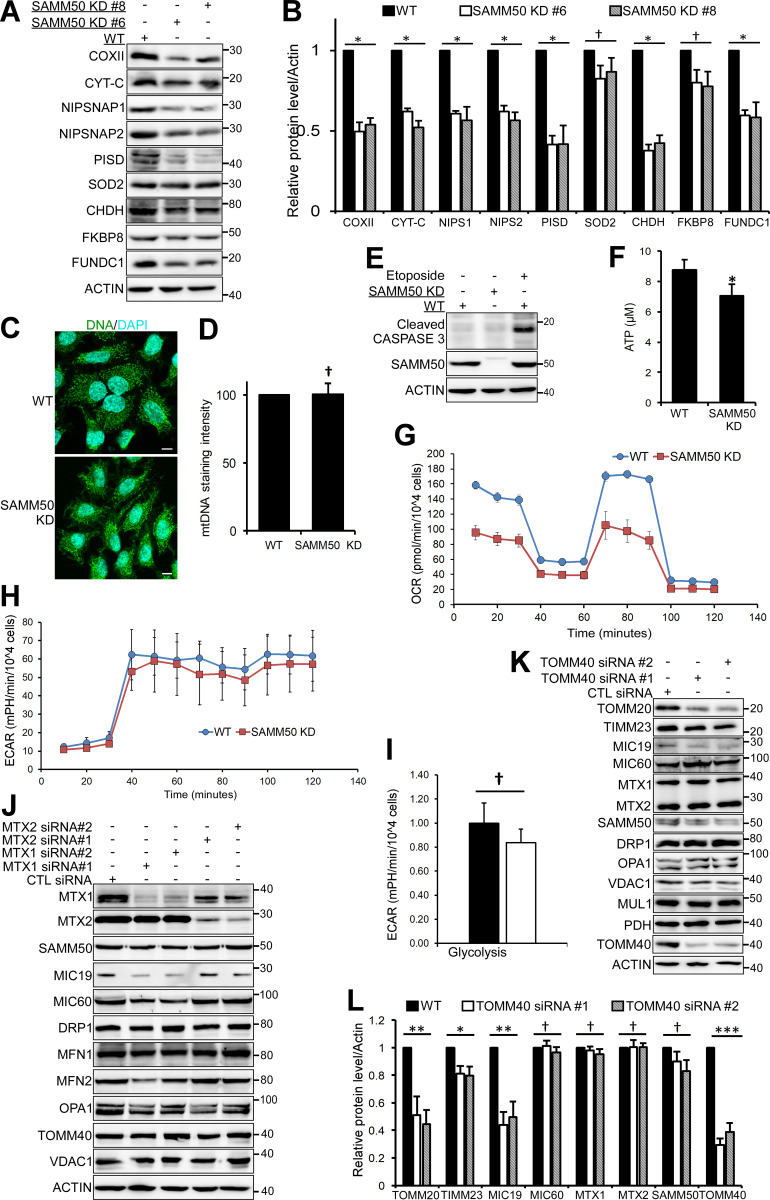
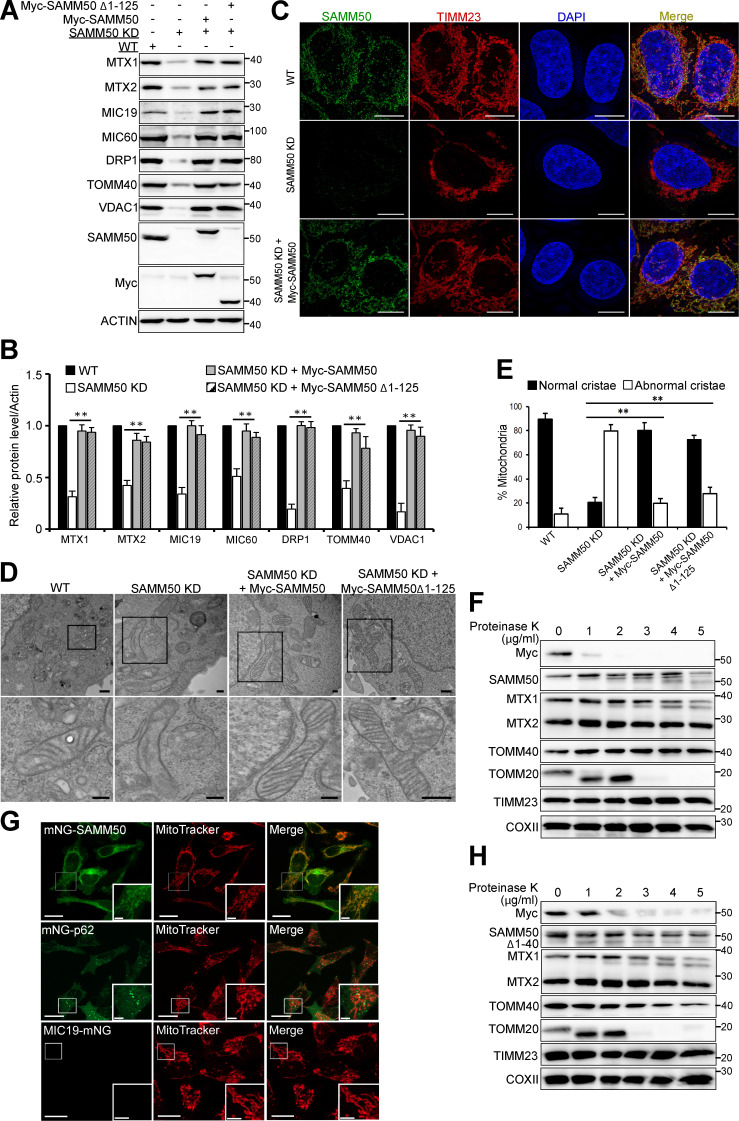
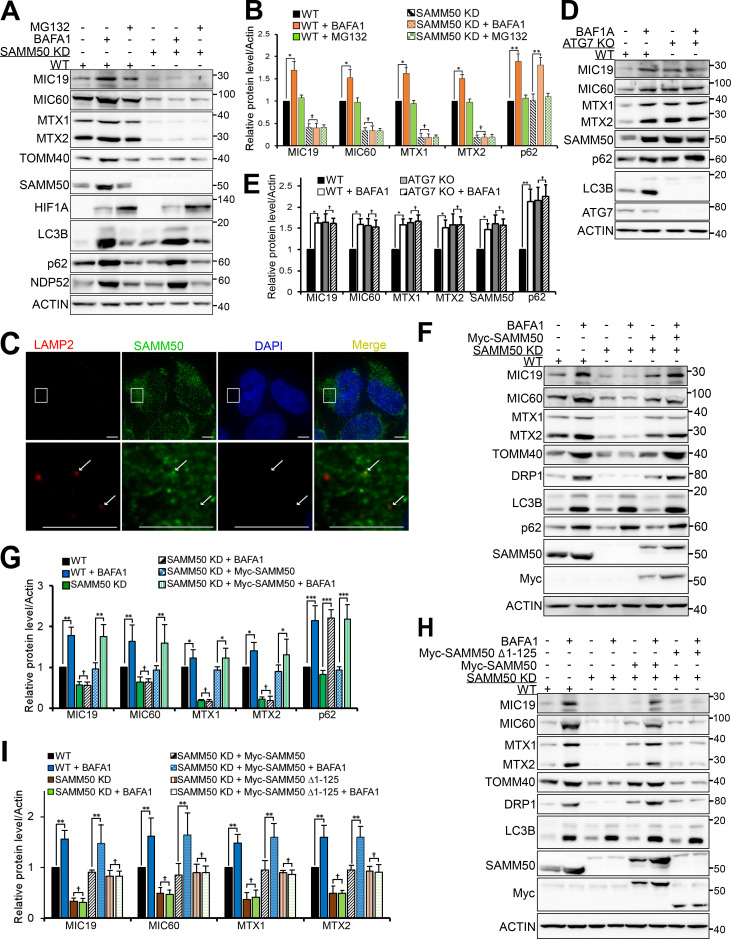
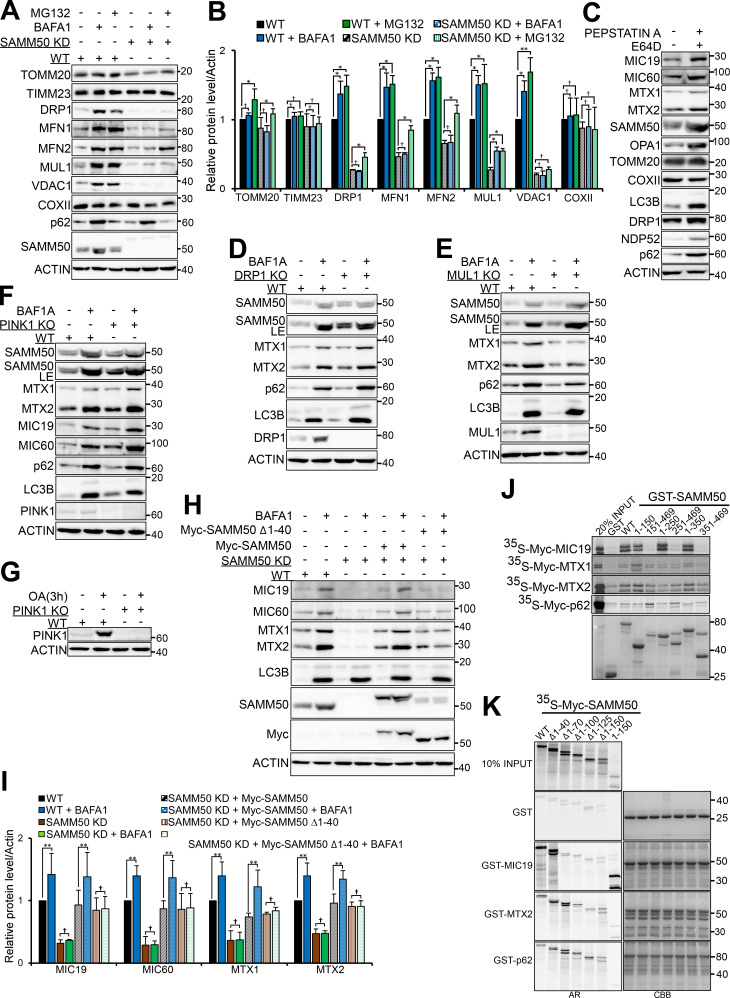
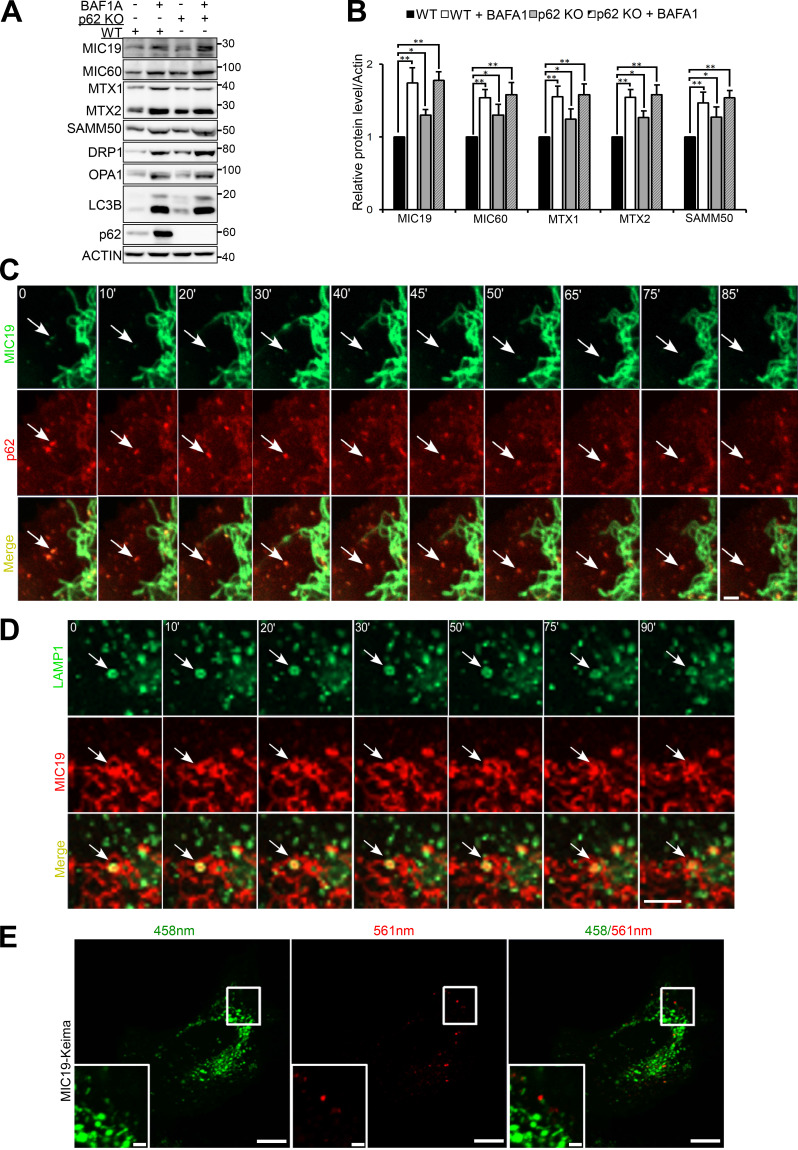
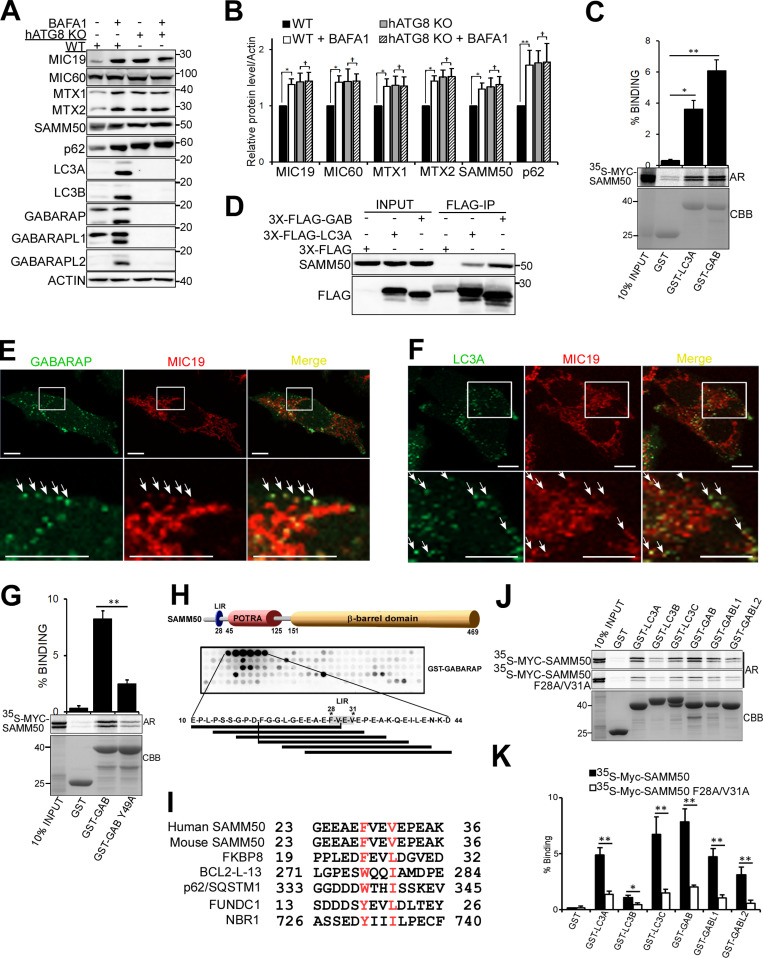
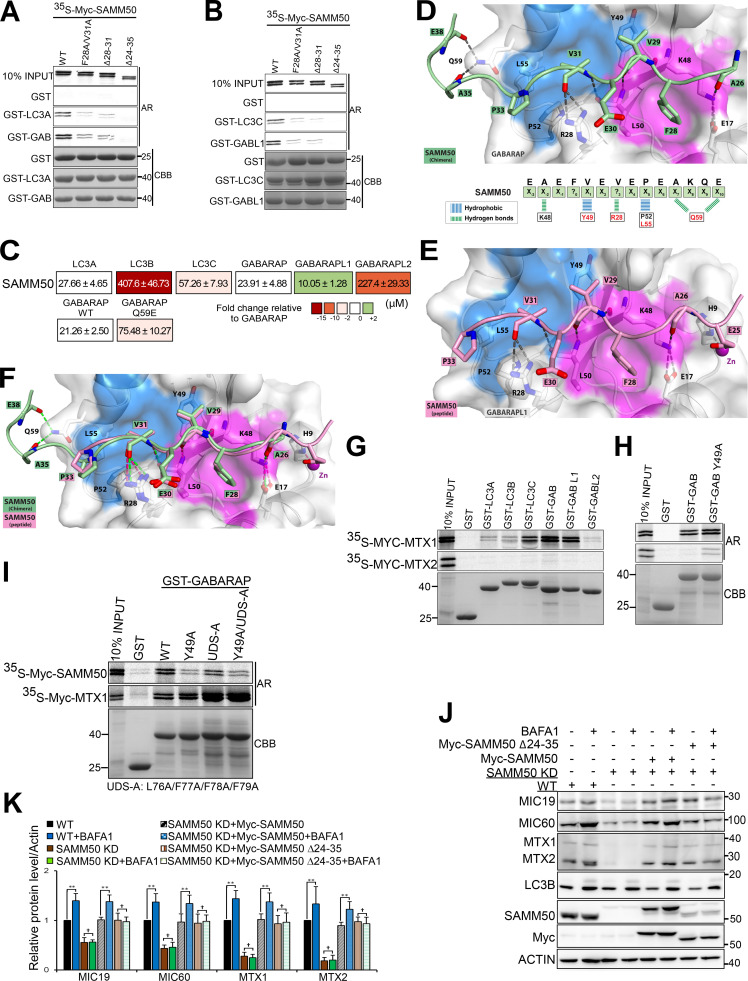
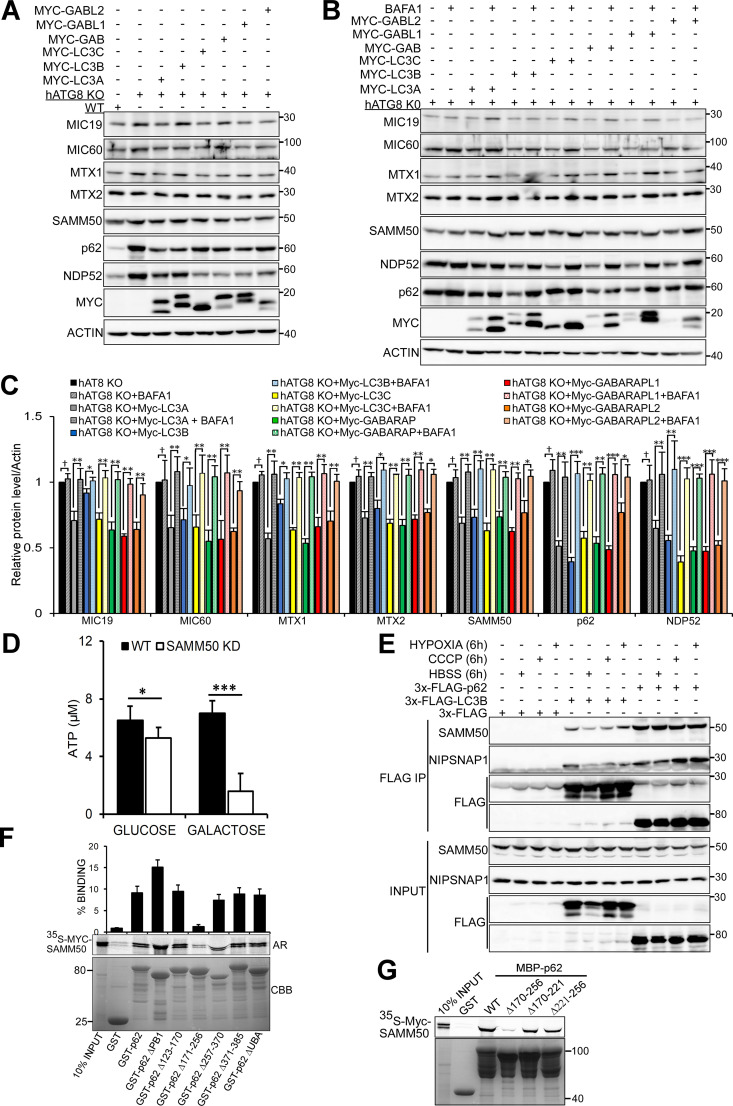
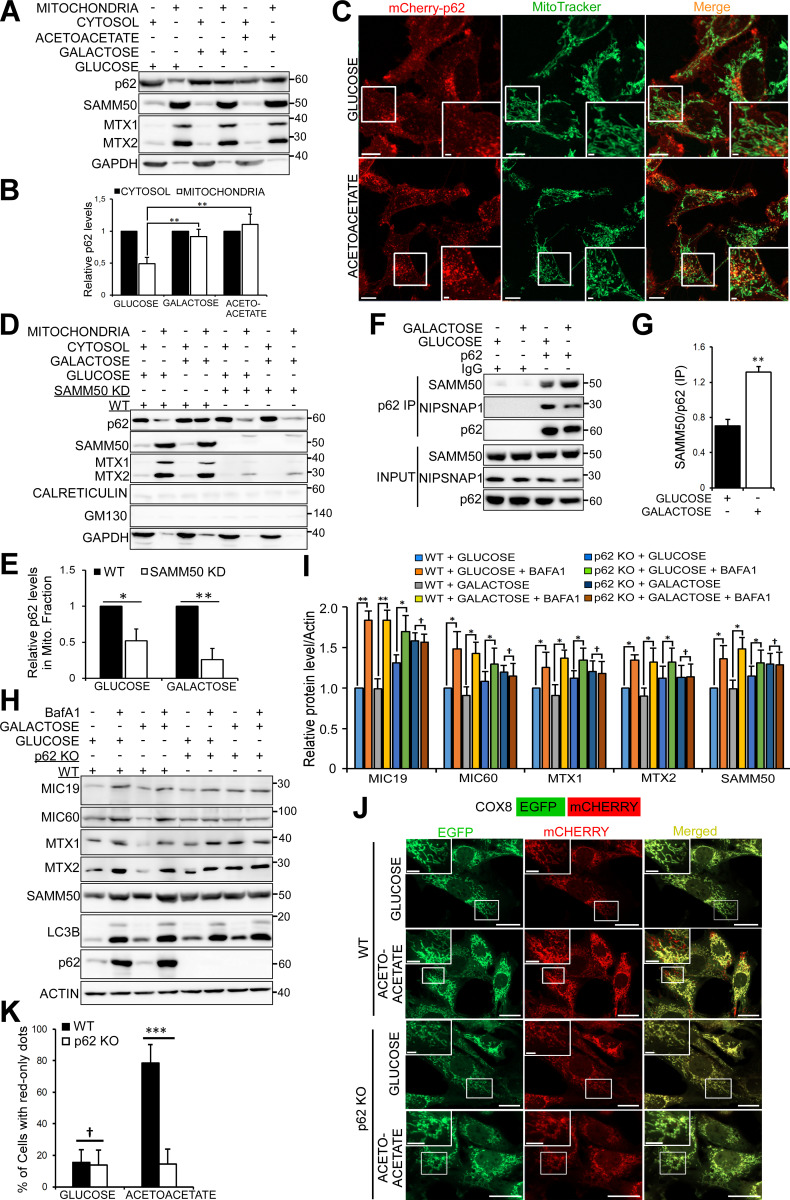
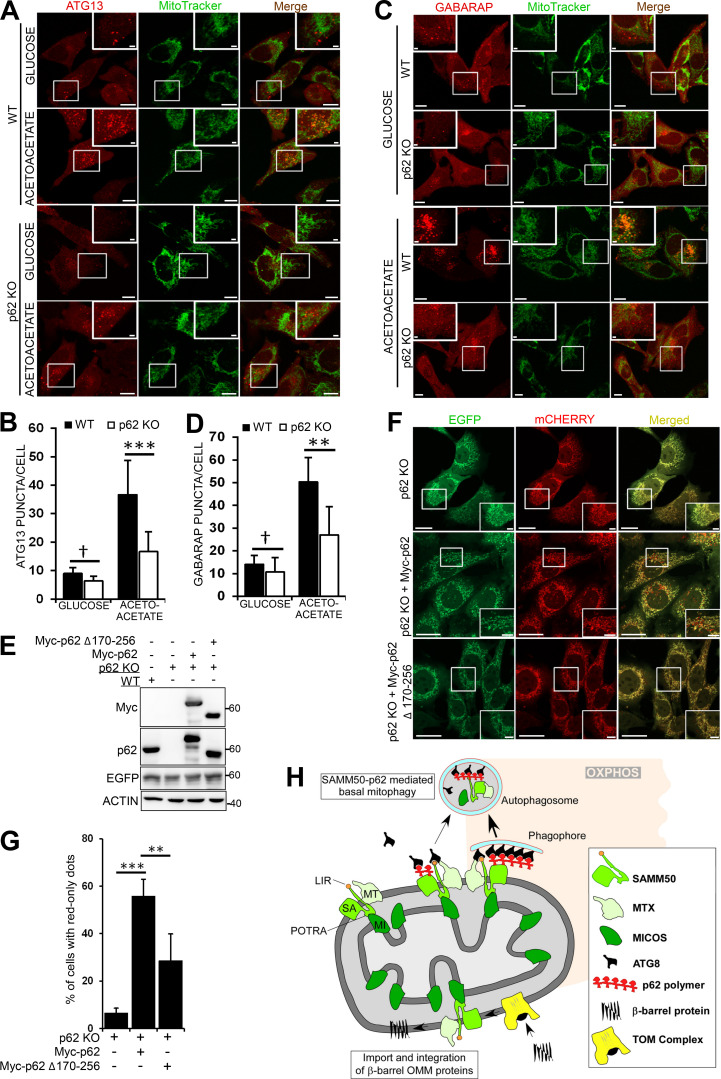
Mitophagy is the degradation of surplus or damaged mitochondria by autophagy. In addition to programmed and stress-induced mitophagy, basal mitophagy processes exert organelle quality control. Here, we show that the sorting and assembly machinery (SAM) complex protein SAMM50 interacts directly with ATG8 family proteins and p62/SQSTM1 to act as a receptor for a basal mitophagy of components of the SAM and mitochondrial contact site and cristae organizing system (MICOS) complexes. SAMM50 regulates mitochondrial architecture by controlling formation and assembly of the MICOS complex decisive for normal cristae morphology and exerts quality control of MICOS components. To this end, SAMM50 recruits ATG8 family proteins through a canonical LIR motif and interacts with p62/SQSTM1 to mediate basal mitophagy of SAM and MICOS components. Upon metabolic switch to oxidative phosphorylation, SAMM50 and p62 cooperate to mediate efficient mitophagy.


Figures

Figure S1.
Figure S1.
p62 associates with several mitochondrial proteins. (A) Endogenous p62 was immunoprecipitated from HeLa cells followed by mass spectrometry analysis of associated proteins. Only some mitochondrial related proteins and proteins showing specific interaction with p62 are presented here. (B) HEK293 cells were subjected to subcellular fractionation and immunoblotted with indicated antibodies. (C) Diffraction-limited DV microscopy images of HeLa cells co-stained with antibodies to endogenous p62 and SAMM50. Nuclear DNA was stained with DAPI. Boxes indicate enlarged images shown below. White arrows indicate colocalization events. Scale bars, 10 µm. (D) GST pulldown using in vitro translated Myc-tagged p62 in the presence of radioactive methionine with GST-tagged mitochondrial proteins. Myc-tagged protein binding was measured by AR while GST-tagged proteins were stained with CBB. (E) Endogenous SAMM50 was immunoprecipitated from HeLa cells followed by mass spectrometry analysis of associated proteins. (F) Myc-tagged SAMM50 was in vitro-translated and its interaction with GST-tagged mitochondrial proteins was tested in GST pulldown assays and analyzed by AR.
Figure 1.
Figure 1.
p62 interacts directly with SAMM50. (A) Endogenous p62 was immunoprecipitated (IP) from HeLa cells followed by immunoblotting with antibodies for mitochondrial proteins identified in mass spectrometric analysis of endogenous p62 immunoprecipitates presented in Fig. S1 A. (B) Subcellular fractions of HeLa cells immunoblotted with the indicated antibodies. CALR, calreticulin. (C) High-resolution live-cell imaging of HeLa cells expressing mCherry-p62 stained with MitoTracker. Arrows indicate p62-containing mitochondrial fragments. Scale bars, 20 µm. (D) High-resolution imaging of HeLa cells stably coexpressing MIC19-EGFP and mCherry-p62 with enlarged images shown above and below. Arrows indicate association of p62 with mitochondria. Scale bars, 10 µm. (E) In vitro translated and [35S]-methionine–labeled Myc-p62 tested in GST-pulldown experiments for interaction with selected mitochondrial proteins. Bound p62 was visualized by autoradiography (AR), and immobilized GST or GST-tagged proteins were stained with CBB. (F) Quantitative analysis of GST pulldowns in E, based on three independent experiments using Science Lab Image Gauge software (Fujifilm). Values are mean ± SD. **, P < 0.005; *, P < 0.01; †, NS; one-way ANOVA. (G) HeLa cell extracts immunoprecipitated with antibody to endogenous SAMM50 and immunoblotted with antibodies to indicated proteins. (H) GST pulldowns of in vitro translated Myc-SAMM50 and indicated GST-tagged proteins as in E. (I) Quantitative analysis of three independent GST pulldowns in H. Statistical values are mean ± SD. ***, P < 0.001; **, P < 0.005; *, P < 0.01; one-way ANOVA.
Figure 2.
Figure 2.
SAMM50 KD alters mitochondrial morphology and depletes a subset of mitochondrial proteins. (A) Expression of SAM complex proteins in lysates from WT and two clones of SAMM50 CRISPR KD HeLa cells. LE, long exposure. (B) Densitometric analysis of MTX1 and MTX2 levels from A. Values are mean ± SD from three independent experiments. **, P < 0.005; one-way ANOVA. (C–F) Whole-cell lysates from WT and SAMM50 KD cells analyzed for expression of indicated mitochondrial proteins (C and E). LE, long exposure. Relative expression levels quantified (D and F) with mean ± SD from three different experiments. **, P < 0.005; *, P < 0.01; †, NS; one-way ANOVA. (G) High-resolution confocal images of WT and SAMM50 KD cells stained with antibodies to endogenous SAMM50 and TIMM23. DNA was stained with DAPI. Scale bars, 10 µm. (H) Quantification of relative fluorescence from G. Fluorescence intensity from 60–80 cells was quantified per sample using ImageJ software. Values are mean ± SD. ***, P < 0.001; *, P < 0.01; one-way ANOVA. (I) Mitochondrial cristae structure in WT and SAMM50 KD cells visualized by TEM. Scale bars, 0.2 µm. (J) Percentage of mitochondria with abnormal cristae were scored in I, based on 200 mitochondria from 8–10 micrographs per sample (see Materials and methods). Values are mean ± SD. **, P < 0.005; one-way ANOVA. (K and L) WT and SAMM50 KD HeLa cells analyzed for mitochondrial shape by TEM. Arrows indicate fused mitochondria (K). Percentage of fused mitochondria was scored in L (see Materials and methods). Values are mean ± SD. **, P < 0.005; one-way ANOVA. Scale bars, 0.5 µm. (M) OXPHOS measured in WT and SAMM50 KD cells using a Seahorse XFp flux analyzer. Graphs show one representative example from three independent experiments. Values are mean ± SD from three replicates. **, P < 0.005; one-way ANOVA.
Figure S2.
Figure S2.
SAMM50 knockdown affects oxidative phosphorylation. (A and B) Lysates from WT and SAMM50 CRISPR KD HeLa cells were analyzed for mitochondrial protein expression by immunoblotting (A) and quantified (B). Values are mean ± SD from three different experiments. *, P < 0.01; †, NS; one-way ANOVA. (NIPS1:NIPSNAP1, NIPS2:NIPSNAP2). (C and D) WT and SAMM50 KD HeLa cells were immunostained with antibody to mtDNA and nuclei stained with DAPI. Mitochondrial DNA (mtDNA) nucleoids were visualized by fluorescence confocal microscopy (C) and staining intensity quantified (D) from 100 cells per sample using the ImageJ software. Values are mean ± SD. †, NS; one-way ANOVA. Scale bars, 10 µm. (E) WT and SAMM50 KD HeLa cells lysates were analyzed for presence of cleaved caspase 3 by immunoblotting. Lysate from WT HeLa cells treated with 100 μM etoposide for 24 h is used as a control. (F) Relative ATP levels from WT and SAMM50 KD cells were measured using the ATP determination kit from three independent experiments. Values are mean ± SD. *, P < 0.01; one-way ANOVA. (G) Direct measurement of OCR was done using a Seahorse XFp flux analyzer. Basal respiration was measured for 30 min. Oligomycin was injected at 30 min, blocking ATP production due to oxidative phosphorylation. FCCP was injected at 60 min, followed by complex I and III inhibitors at 90 min, showing differences in maximal mitochondrial capacity. (H) Direct measurements of ECAR was done using a Seahorse XFp flux analyzer. (I) Glycolytic rates in WT and SAMM50 KD HeLa cells were measured using a Seahorse XFp flux analyzer. Graphs show one representative from three independent experiments. Values are ± SD from three replicates. †, NS. (J) Lysates from HeLa cells treated with either control (CTL) siRNA or two different siRNA to MTX1 and MTX2 for 6 d (three pulses of 48 h each) were immunoblotted with the indicated antibodies. (K and L) Lysates from HeLa cells treated with control siRNA or two different siRNAs to TOMM40 for 4 d (two pulses of 48 h each) were immunoblotted with indicated antibodies (K) and quantified (L). Values are mean ± SD from three different experiments. ***, P < 0.001; **, P < 0.005; *, P < 0.01; †, NS; one-way ANOVA.
Figure S3.
Figure S3.
The SAMM50 N-terminal region with the NTS and POTRA domain is not required for mitochondrial protein biogenesis. (A and B) Whole cell lysates from WT cells and two clones of SAMM50 KD cells were immunoblotted to reveal PINK1, p62 and LC3B protein levels (A) and quantified (B). Values are mean ± SD from three different experiments. **, P < 0.005; *, P < 0.01; †, NS; one-way ANOVA. (C and D) HeLa cells were either treated with CTL siRNA or two different siRNA to TOMM40 and analyzed for the levels of indicated proteins by immunoblotting (C) and quantified (D). Values are mean ± SD from three different experiments. **, P < 0.005; *, P < 0.01; one-way ANOVA. (E and F) WT and SAMM50 KD cells were treated with a combination of OA for 3h and protein levels of PINK1 were analyzed by immunoblotting (E) and quantified (F). Values are mean ± SD from three different experiments. ***, P < 0.001; **, P < 0.005; one-way ANOVA. (G) Domain architecture of SAMM50 showing WT and various deletion constructs used in reconstituting SAMM50 KD cells. (H) Expression of the indicated mitochondrial proteins in WT, SAMM50 KD, AND SAMM50 KD cells reconstituted with WT SAMM50 or SAMM50 Δ1-125 mutant was analyzed by immunoblotting. (I and J) WT, SAMM50 KD, and SAMM50 KD cells reconstituted with Myc-SAMM50 and indicated deletion mutants were analyzed for expression of the indicated mitochondrial proteins by immunoblotting (I) and quantified (J). Values are mean ± SD from three different experiments. ***, P < 0.001; **, P < 0.005; one-way ANOVA. (K) Isolated mitochondria from SAMM50 KD cells reconstituted with Myc-SAMM50 were subjected to digestion with different concentration of proteinase K. Mitochondria protein levels were analyzed by immunoblotting with indicated antibodies.
Figure 3.
Figure 3.
The N-terminal domain of SAMM50 is dispensable for its activity and is oriented to the cytoplasm. (AandB) Whole-cell lysates of WT, SAMM50 KD, and SAMM50 KD HeLa cells reconstituted with Myc-tagged SAMM50 WT and SAMM50 Δ1–125 mutant analyzed for mitochondrial protein expression by immunoblotting (A), and relative expression levels were quantified (B). Values are mean ± SD from three independent experiments. **, P < 0.005; one-way ANOVA. (C) SIM of WT, SAMM50 KD, and SAMM50 KD cells reconstituted with Myc-SAMM50 and stained with antibodies to SAMM50 and TIMM23. Scale bars, 10 µm. (D) TEM of mitochondrial ultrastructure of WT, SAMM50 KD, and SAMM50 KD cells reconstituted with either WT Myc-SAMM50 or Myc-SAMM50 Δ1–125. Scale bars, 0.2 µm. (E) Cristae morphology shown in D was scored based on 150 mitochondria from 9–10 micrographs per sample (see Materials and methods). Values are mean ± SD. **, P < 0.005; one-way ANOVA. (F) Mitochondria from SAMM50 KD cells reconstituted with Myc-SAMM50 subjected to increasing concentrations of proteinase K analyzed by immunoblotting. (G) SAMM50 and p62 were N-terminally tagged, while MIC19 was C-terminally tagged, with the 11th β-sheet of split fluorescent modified mNG11 and stably coexpressed, respectively, in HeLa cells stably expressing the first 10 β-sheets of modified mNG1-10 in a Tet-off/on system. Fluorescence complementation was induced with 1 µg/ml Tet overnight and analyzed by live-cell imaging. Mitochondria were imaged with MitoTracker Deep Red. Scale bars, 20 µm (main), 5 µm (inset). (H) Mitochondria from SAMM50 KD cells reconstituted with Myc-SAMM50 Δ1–40 treated with increasing concentrations of proteinase K and immunoblotted with the indicated antibodies.
Figure 4.
Figure 4.
SAMM50 mediates basal lysosomal degradation of members of the SAM and MICOS complex. (A) Immunoblots of lysates of WT and SAMM50 KD HeLa cells untreated or treated with BafA1 or MG132 for 24 h. (B) Densitometric analysis of protein levels for A from four independent experiments. Values are mean ± SD. **, P < 0.005; *, P < 0.01; †, NS; one-way ANOVA. (C) Diffraction-limited DV microscopic images of WT HeLa cells stained with antibodies to LAMP2 and SAMM50. Arrows indicate colocalization. Scale bars, 10 µm. (D and E) Immunoblots of extracts from WT and ATG7 KO HeLa cells untreated or treated with BafA1 for 24 h (D) and quantified (E). Values are mean ± SD. **, P < 0.005; *, P < 0.01; †, NS; one-way ANOVA. (F) Immunoblots of extracts of WT, SAMM50 KD, and SAMM50 KD cells reconstituted with Myc-SAMM50 untreated or treated with BafA1 for 24 h. (G) Relative protein levels for F from three independent experiments. Values are mean ± SD. ***, P < 0.001; **, P < 0.005; *, P < 0.01; †, NS; one-way ANOVA. (H) Immunoblots of lysates from WT, SAMM50 KD, and SAMM50 KD reconstituted with either Myc-SAMM50 WT or SAMM50 Δ1–125, untreated or treated with BafA1 for 24 h. (I) Relative protein levels for H from three independent experiments. Values are mean ± SD. **, P < 0.005; †, NS; one-way ANOVA.
Figure S4.
Figure S4.
SAMM50 is important for basal mitophagy. (A and B) Lysates from WT and SAMM50 KD HeLa cells left untreated or treated with either BafA1 or MG132 for 24 h, respectively, were immunoblotted with indicated antibodies (A) and quantified (B). Values are mean ± SD from three different experiments. **, P < 0.005; *, P < 0.01; †, NS; one-way ANOVA. (C) Lysates from HeLa cells treated with a combination of Pepstatin A and E64d for 24 h to block lysosomal protein degradation were immunoblotted using the indicated antibodies. (D and E) WT, DRP1 KO (D), and MUL1 KO (E) cells were treated with BafA1 for 24 h followed by immunoblotting with indicated antibodies. (F and G) WT and PINK1 KO cells were left untreated or treated with either BafA1 for 24h (F) or a combination of OA for 3h (G). Indicated protein levels were analyzed by immunoblotting. (H) WT, SAMM50 KD, and SAMM50 KD HeLa cells reconstituted with Myc-SAMM50 WT and Myc-SAMM50 Δ1-40 mutant were either untreated or treated with BafA1 for 24 h. Lysates were prepared and used for immunoblotting with the indicated antibodies. (I) Densitometric analysis of relative protein levels for (H) from three independent experiments. Values are mean ± SD. **, P < 0.005; †, NS; one-way ANOVA. (J and K) Mapping of binding site on SAMM50 for MIC19, MTX1, MTX2, and p62. (J) Myc-tagged proteins were in vitro translated in the presence of radioactive methionine and used in GST-pulldown assay with GST-tagged SAMM50 WT and indicated mutants. (K) In vitro translated SAMM50 WT and indicated mutants with GST and GST-tagged MIC19, MTX2, and p62. Bound Myc-tagged proteins were detected by AR while GST proteins were stained with CBB.
Figure 5.
Figure 5.
SAMM50-dependent basal piecemeal mitophagy requires p62 and hATG8 proteins. (A and B) Immunoblots of extracts of WT and p62 KO HeLa cells treated with BafA1 for 24 h (A) and quantified (B). Values are mean ± SD from three different experiments. **, P < 0.005; *, P < 0.01; one-way ANOVA. (C) Time-lapse (seconds) live-cell confocal imaging of HeLa cells stably expressing mCherry-p62 and MIC19-EGFP. Arrows show mitochondrial fragment colocalized with p62 and subsequently degraded (see Video 1). Scale bar, 5 µm. (D) Time-lapse (seconds) live-cell confocal imaging of HeLa cells stably coexpressing LAMP1-EGFP and MIC19-mCherry. Arrows indicate mitochondrial fragment engulfed by a lysosome (see Video 2). Scale bar, 2 µm. (E) Live-cell images of HeLa cells stably expressing MIC19-Keima excited at 458 nm in a neutral environment (mitochondria; green) and at 561 nm in an acidic environment (lysosome; red). Scale bars, 10 µm (main), 2 µm (inset).
Figure 6.
Figure 6.
SAMM50 interacts with hATG8 proteins to regulate basal mitophagy. (A) Immunoblots of extracts of WT and HeLa cells with KO of all six hATG8 proteins untreated or treated with BafA1 for 24 h. (B) Relative protein levels for A from three independent experiments. Values are mean ± SD. **, P < 0.005; *, P < 0.01; †,NS; one-way ANOVA. (C) GST-pulldown assays with in vitro translated Myc-SAMM50 and recombinant GST, GST-LC3A, and GST-GABARAP. Values are mean ± SD from three independent experiments. **, P < 0.005; *, P < 0.01; one-way ANOVA. (D) Coimmunoprecipitation of endogenous SAMM50 from HeLa cells transiently transfected with 3x-Flag-LC3A or 3x-Flag-GABARAP. (E) Live-cell images of HeLa cells stably expressing EGFP-GABARAP and MIC19-mCherry. Arrows indicate colocalization between mitochondrial fragments and GABARAP. Scale bars, 10 µm. See Video 3. (F) Live-cell images of HeLa cells stably expressing EGFP-LC3A and MIC19-mCherry. Arrows indicate colocalization between mitochondrial fragments and LC3A. Scale bars, 10 µm. See Video 4. (G) GST-pulldown assay with in vitro translated Myc-SAMM50 and recombinant GST, GST-GABARAP, and GST-GABARAP F49A LDS mutant. Values are mean ± SD from three independent experiments. **, P < 0.005; one-way ANOVA. (H) Domain architecture of SAMM50 with positions of LIR, POTRA, and β-barrel domains. Peptide array of 20-mer peptides spanning full-length SAMM50 probed with GST-GABARAP and developed with GST antibody. Each peptide was moved three amino acids relative to the previous one. (I) Sequence alignment of canonical LIR motifs in human and mouse SAMM50 and other mitophagy receptors FKBP8, BCL2-L-13, FUNDC1, and autophagy receptors p62 and NBR1. (J and K) GST pulldowns with GST-tagged hATG8s and in vitro translated Myc-SAMM50 WT and the F28A/V31A mutant (J) quantified in K from three independent experiments. Values are mean ± SD. **, P < 0.005; *, P < 0.01; one-way ANOVA.
Figure 7.
Figure 7.
SAMM50 binds to ATG8 proteins via an LIR motif in the NTS. (A and B) GST pulldowns with GST-hATG8 proteins and in vitro translated WT or LIR mutant Myc-SAMM50. (C) Affinities (Kd values) of SAMM50 LIR peptides to hATG8 proteins determined by BLI. Color code indicates fold changes relative to WT GABARAP. (D and E) Structure of the SAMM50 LIR bound to GABARAP and GABARAPL1. (D) Close-up of chimera structure of SAMM50 LIR bound to GABARAP. SAMM50 LIR (aa 24–38) is in green ribbon with interacting residues as sticks and GABARAP in white cartoon and transparent surface with HP1 and HP2 colored in pink and blue surfaces, respectively. (E) Close-up of SAMM50 LIR bound to GABARAPL1. The LIR (aa 24–38) is in pink ribbon with interacting residues as sticks. GABARAPL1 is in white cartoon, and transparent surface with HP1 and HP2 colored in pink and blue, respectively. (F) Superposition of chimera structure of SAMM50 LIR chimera (green) bound to GABARAP and SAMM50 LIR peptide (pink) bound to GABARAPL1. Both LIRs are in cartoon with interacting residues as sticks. GABARAP and GABARAPL1 are in white cartoon, and transparent surface with HP1 and HP2 colored in pink and blue, respectively. (G and H) GST pulldowns of in vitro translated Myc-MTX1 and Myc-MTX2 with recombinant GST-hATG8s (G) or with GST-GABARAP WT and the Y49A mutant (H). (I) GST pulldowns of in vitro translated Myc-SAMM50 and Myc-MTX1 with recombinant GST-GABARAP and indicated mutants. (J) Immunoblots of lysates of WT, SAMM50 KD, and SAMM50 KD HeLa cells reconstituted with Myc-SAMM50 WT and Myc-SAMM50 Δ24–35 mutant untreated or treated with BafA1 for 24 h. (K) Relative protein levels in J from three independent experiments. Values are mean ± SD. **, P < 0.005; †, NS; one-way ANOVA. UDS, ubiquitin-interacting motif docking site.
Figure S5.
Figure S5.
hATG8 proteins are required for basal mitophagy. (A) Lysates from WT, hATG8 KO, and hATG8 KO HeLa cells reconstituted with individual Myc-tagged hATG8 proteins were immunoblotted with indicated antibodies. (B and C) hATG8 KO cells were reconstituted with individual Myc-tagged human ATG8 proteins, and cells were treated or not with BafA1 for 24h. Lysates were immunoblotted with indicated antibodies (B), and the ability of individual ATG8 proteins to restore basal mitophagy monitored as an increase in mitochondrial protein level upon treatment with BafA1 were quantified (C). Values are mean ± SD. ***, P < 0.001; **, P < 0.005; *, P < 0.01; †, NS; one-way ANOVA. (D) Relative ATP levels from WT and SAMM50 KD cells grown in either glucose or galactose media were measured with an ATP determination kit. Values are mean ± SD based on three independent experiments. ***, P < 0.001; *, P < 0.01; one-way ANOVA. (E) Extracts from HeLa cells transiently transfected with 3x-FLAG, 3x-FLAG-LC3B, and 3x-FLAG-p62 expression vectors and treated with CCCP, hypoxia (1% oxygen), and HBSS for 6h were immunoprecipitated with FLAG resin. Co-immunoprecipitation of endogenous NIPSNAP1 and SAMM50 was analyzed by immunoblotting. (F and G) Mapping of the SAMM50 binding site on p62. Myc-SAMM50 in vitro translated in the presence of radioactive methionine was incubated with recombinant GST, GST-p62 WT, and indicated deletion constructs (F) or with recombinant MBP, MBP-p62, and indicated mutants (G). Bound SAMM50 was analyzed by AR, and GST-tagged proteins were stained with CBB. The graphs in F represent percentage binding of in vitro translated Myc-SAMM50 to recombinant GST proteins. Values are mean ± SD based on three independent experiments.
Figure 8.
Figure 8.
p62/SQSTM1 is indispensable for OXPHOS-induced mitophagy. (A) Immunoblots of cytosolic and mitochondrial fractions of HeLa cells grown in media with glucose, galactose, or acetoacetate as the sole sugar source. (B) p62 protein levels in A from three independent experiments with mean ± SD. **, P < 0.005; one-way ANOVA. (C) Live-cell imaging of HeLa cells stably expressing mCherry-p62 and stained with MitoTracker. Cells were grown in media with either glucose or acetoacetate. Scale bars, 10 µm (main), 2 µm (inset). (D) Immunoblots of cytosolic and mitochondrial fractions from WT and SAMM50 KD cells grown in glucose or galactose media. (E) Quantification of p62 recruitment to mitochondria (Mito.) in D. Values are mean ± SD from three different experiments. **, P < 0.005; *, P < 0.01; one-way ANOVA. (F) Immunoprecipitates (IP) of endogenous p62 from HeLa cells grown in glucose or galactose media analyzed for coprecipitation of endogenous SAMM50 and NIPSNAP1 by immunoblotting. (G) Quantification of coimmunoprecipitated (IP) SAMM50 in F from three independent experiments. Values are mean ± SD. **, P < 0.005; one-way ANOVA. (H and I) Immunoblots of WT and p62 KO HeLa cells grown in glucose or galactose media untreated or treated with BafA1 for 24 h (H) with quantifications from three independent experiments (I). Values are mean ± SD. **, P < 0.005; *, P < 0.01; †, NS; one-way ANOVA. (J) Live-cell images of WT and p62 KO MEFs stably expressing COX8-EGFP-mCherry grown in glucose media or glucose-free acetoacetate-containing media for 96 h. Scale bars, 20 µm. (K) Percentage of cells with red-only dots signifying mitophagy quantified in J from three independent experiments. Values are mean ± SD. ***, P < 0.001; †, NS; one-way ANOVA.
Figure 9.
Figure 9.
The interaction between SAMM50 and p62/SQSTM1 is important for OXPHOS-induced mitophagy. (A) Live cell images of WT and p62 KO MEF cells stably expressing mCherry-ATG13 grown in glucose media or glucose-free acetoacetate-containing media for 96 h. Cells were stained with MitoTracker. Enlarged insets are indicated. Scale bars, 10 µm (main), 2 µm (inset). (B) ATG13 puncta quantified per cell in A in ∼60 cells for each treatment. Values are mean ± SD. ***, P < 0.001; †, NS; one-way ANOVA. (C) Live-cell images of WT and p62 KO MEFs stably expressing mCherry-GABARAP grown in glucose or acetoacetate media for 96 h and stained with MitoTracker. Scale bars, 10 µm (main), 2 µm (inset). (D) GABARAP puncta per cell quantified in C in ∼60 cells for each treatment. Values are mean ± SD. **, P < 0.005; †, NS; one-way ANOVA. (E) Immunoblots of lysates of WT, p62 KO, and p62 KO MEFs reconstituted with Myc-p62 or Myc-p62 Δ170–256 stably expressing COX8-EGFP-mCherry. (F) Live-cell images of p62 KO MEFs and p62 KO MEFs reconstituted with Myc-p62 or Myc-p62 Δ170–256 stably expressing COX8-EGFP-mCherry grown in media containing acetoacetate for 96 h. Scale bars, 20 µm (main), 5 µm (inset). (G) Percentage of cells with red-only dots signifying mitophagy quantified in F from three different experiments. Values are mean ± SD. ***, P < 0.001; **, P < 0.005; one-way ANOVA. (H) Model for basal piecemeal and OXPHOS-induced mitophagy. SAMM50 interacts with SAM and MICOS complex proteins and recruits hATG8 and p62 to these fragments. The fragments are recruited to p62 puncta, which mark sites of forming autophagosomes. The fragmented mitochondria are enclosed in the autophagosome and subsequently degraded in the lysosome.

References

    1. Abudu, Y.P., Pankiv S., Mathai B.J., Håkon Lystad A., Bindesbøll C., Brenne H.B., Yoke Wui Ng M., Thiede B., Yamamoto A., Mutugi Nthiga T., et al. . 2019. NIPSNAP1 and NIPSNAP2 act as “eat me” signals for mitophagy. Dev. Cell. 49:509–525.e12. 10.1016/j.devcel.2019.03.013 - DOI - PubMed
    1. Adams, P.D., Afonine P.V., Bunkóczi G., Chen V.B., Davis I.W., Echols N., Headd J.J., Hung L.W., Kapral G.J., Grosse-Kunstleve R.W., et al. . 2010. PHENIX: a comprehensive Python-based system for macromolecular structure solution. Acta Crystallogr. D Biol. Crystallogr. 66:213–221. 10.1107/S0907444909052925 - DOI - PMC - PubMed
    1. Aguirre, J.D., Dunkerley K.M., Mercier P., and Shaw G.S.. 2017. Structure of phosphorylated UBL domain and insights into PINK1-orchestrated parkin activation. Proc. Natl. Acad. Sci. USA. 114:298–303. 10.1073/pnas.1613040114 - DOI - PMC - PubMed
    1. Al Rawi, S., Louvet-Vallée S., Djeddi A., Sachse M., Culetto E., Hajjar C., Boyd L., Legouis R., and Galy V.. 2011. Postfertilization autophagy of sperm organelles prevents paternal mitochondrial DNA transmission. Science. 334:1144–1147. 10.1126/science.1211878 - DOI - PubMed
    1. Alers, S., Wesselborg S., and Stork B.. 2014. ATG13: just a companion, or an executor of the autophagic program? Autophagy. 10:944–956. 10.4161/auto.28987 - DOI - PMC - PubMed

Publication types

MeSH terms

Substances