. 2021 Sep;69(9):2235-2251.
doi: 10.1002/glia.24032. Epub 2021 May 26.

Regulation of aquaporin-4 expression in the central nervous system investigated using M23-AQP4 null mouse

Affiliations

Regulation of aquaporin-4 expression in the central nervous system investigated using M23-AQP4 null mouse

Francesco Pisani et al. Glia. 2021 Sep.

Abstract

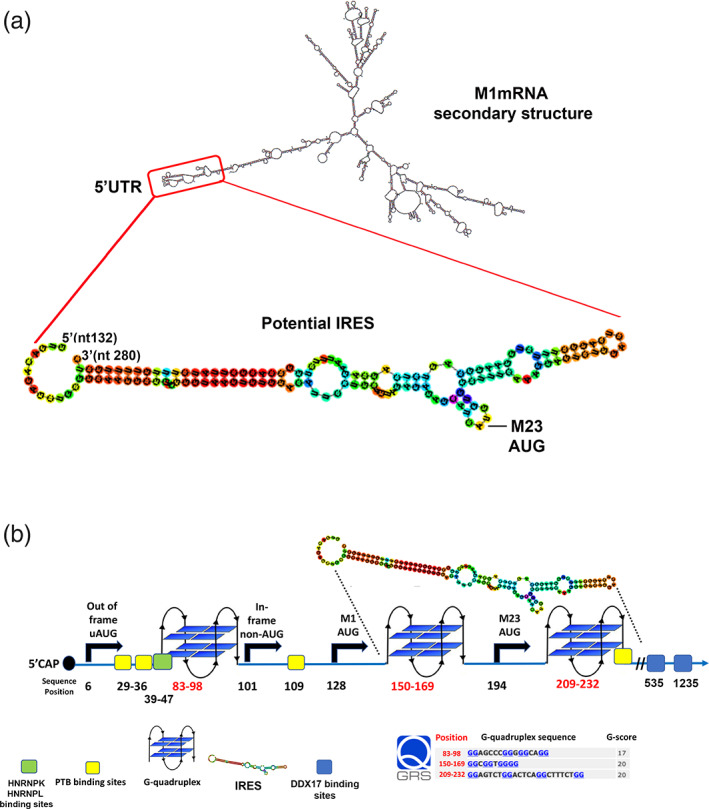
In astrocytes, unknown mechanisms regulate the expression of M1 and M23 isoforms of water channel aquaporin-4 (M1-AQP4 and M23-AQP4). The ratio between these two isoforms controls the AQP4 assembly state in the plasma membrane known as orthogonal arrays of particles (OAPs). To give new insights into these mechanisms, here, we explore the regulation of AQP4 expression in the spinal cord of a CRISPR/Cas9 M23-null mouse model (M23-null). In the M23-null spinal cord OAP assembly, the perivascular localization of AQP4 and M1-AQP4 protein were drastically reduced. In heterozygous, M1-AQP4 was proportionally reduced with M23-AQP4, maintaining the isoform ratio unaffected. We hypothesize a role of the M23-AQP4 in the regulation of M1-AQP4 expression. M1-AQP4 transcription, splicing and M1-AQP4 protein degradation were found to be unaffected in M23-null spinal cord and in M23-null astrocyte primary culture. The translational control was investigated by mRNA-protein pull down and quantitative mass spectrometry, to isolate and quantify AQP4 mRNA binding proteins (AQP4-RBPs). Compared to WT, in M23-null spinal cord, the interaction between AQP4 mRNA and polypyrimidine tract binding protein 1, a positive regulator of AQP4 translation, was higher, while interaction with the RNA helicase DDX17 was lower. In astrocyte primary cultures, DDX17 knockdown upregulated AQP4 protein expression and increased cell swelling, leaving AQP4 mRNA levels unchanged. Here, we identify AQP4-RBPs and provide evidence that in mouse spinal cord M23-AQP4 deletion changes the interaction between AQP4 mRNA and some RBPs involved in AQP4 translation. We describe for the first time the RNA helicase DDX17 as a regulator of AQP4 expression in astrocytes.

Keywords: AQP4 mRNA binding proteins; CRISPR/Cas9 M23-null mouse model; DDX17; PTBP1; translational regulation.


Conflict of interest statement

The authors declare no conflict of interest.

Figures

FIGURE 1
FIGURE 1
Orthogonal arrays of particles (OAP) assembly, aquaporin‐4 (AQP4) localization, and M1/M23 expression in WT, heterozygous and M23‐null spinal cord. (a) Right, BN/PAGE analysis of AQP4 supramolecular assembly in WT and M23‐null mice spinal cord. OAPs of different sizes are visible in WT, while they are completely absent in M23‐null mice, indicated by arrow heads. Left, densitometric analysis of AQP4 tetramer. Tetramer is strongly upregulated in M23‐null mice. ***p < .001 M23‐null versus WT. n = 4 for each genotype. Student's t test for unpaired data. (b) AQP4 (green) and GFAP (red) localization in mouse spinal cord sections analyzed by single scan confocal microscopy. In WT, AQP4 is strongly expressed at both protoplasmic astrocytes of gray matter (GM) and fibrous astrocytes of white matter (WM). In M23‐null mice, the AQP4 signal is strongly reduced in both sites and the perivascular staining is completely absent. M23‐null mice only show low AQP4 staining in fibrous astrocytes of white matter (arrowheads). n = 6 for each genotype. No staining was observed in AQP4 KO mice spinal cord sections. (c) Western blotting analysis of M1‐AQP4 and M23‐AQP4 expression using C‐terminal specific antibody. Densitometric analysis of M1‐AQP4 expression (middle), and M23/M1 ratio (right). Data were analyzed by one‐way ANOVA with Tukey's multiple comparisons test for M1/actin (%) and Student's t test for unpaired data for M23/M1 ratio analysis. ***p < .001 versus WT; ****p < .0001 versus WT; n.s. not statistically significant. Number of animals: WT (n = 6), heterozygous (n = 3), M23‐null (n = 6). (d) Western blotting analysis of M1‐AQP4 expression using M1‐AQP4‐specific antibody. Densitometric analysis of M1‐AQP4 expression using M1‐AQP4‐specific antibody (right). Data are reported as a percentage of M1‐AQP4 expression considering the M1‐AQP4 expression in WT as 100% and analyzed by one‐way ANOVA with Tukey's multiple comparisons test. ***p < .001 versus WT; ****p < .0001 versus WT; n.s. not statistically significant. Number of animals: WT (n = 6), heterozygous (n = 3), M23‐null (n = 6). Samples from the same animals were analyzed both with C‐terminal specific and with M1‐AQP4‐specific antibodies [Color figure can be viewed at wileyonlinelibrary.com]
FIGURE 2
FIGURE 2
Analysis of M1‐aquaporin‐4 (AQP4) mRNA levels, alternative splicing and posttranslational control of Aqp4 gene in M23‐null mice spinal cord. (a) Reference sequence details of mouse AQP4 transcripts and schematic position of total‐ and M1‐AQP4‐mRNA‐specific primers used in qPCR. Sequences obtained by NCBI (Gene ID: 11829). (b) AQP4‐Isoform specific qPCR analysis in spinal cord of WT and M23‐null mice. No differences in M1‐AQP4 mRNA or AQP4‐tot mRNAs levels were observed between WT and M23‐null. n = 4 for each genotype. n.s. not statistically significant M23‐nullvs WT. Student's t test for unpaired data. (c) AQP4‐Δ4 specific RT‐PCR in WT and M23‐null mice. No trace of Δ4 isoform (218 bp) was observed in spinal cord, only the full‐length mRNA (299 bp) was detected. n = 4 for each genotype. (c) Analysis of AQP4‐protein degradation in spinal cord of WT and M23‐null mice. Early‐stopped SDS‐PAGE and Western blotting showed no sign of AQP4 degradation in M23‐null mice. n = 4 for each genotype. (e) Analysis of M1M23I protein stability in transfected HEK cells. Cycloheximide (CHX)‐treated M1 and M1M23I expressing cells were analyzed for M1‐AQP4 protein expression at 0, 4, and 8 h after CHX treatment as indicated in each lane. (f) Densitometric analysis of Western blotting reported in Panel (e). No difference in M1‐AQP4 protein posttranslational stability was observed between WT (M1‐AQP4) and mutated (M1M23I) protein. n = 3 for each time point, n.s. not statistically significant M1M23I versus M1 for each time point. Student's t test for unpaired data. (g) Analysis of M1M23I protein expression in the presence of M23‐AQP4 isoform in co‐transfected HEK cells. HEK cells were co‐transfected with five parts of M23‐AQP4 and with one part of M1M23I, to mimic the isoform ratio observed in WT spinal cord. The empty vector was used as control DNA to equalize the DNA amount. No sign of M1M23I protein stabilization was observed in the presence of M23‐AQP4 isoform. n = 4–6 for each condition. Student's t test for unpaired data. (h) Cycloheximide (CHX) assay analysis of M1‐AQP4 posttranslational stability in WT and M23‐null astrocyte primary culture. WT and M23‐null astrocyte were treated with 30 μM CHX for 0, 4, and 8 h and M1‐AQP4 was measured by Western blotting. No difference in the M1‐AQP4 stability was observed between WT and M23‐null astrocyte. n = 3 for each condition. Student's t test for unpaired data [Color figure can be viewed at wileyonlinelibrary.com]
FIGURE 3
FIGURE 3
Aquaporin‐4 (AQP4)‐translational control in mouse spinal cord explored by RNA‐protein pull down and quantitative LC mass spectrometry (MS)/MS analysis. (a) Overview of RNA‐protein assay. The spinal cord cDNA was amplified by M1‐AQP4 mRNA‐specific AQP4 primers to obtain a T7 promoter linked PCR. Primers were designed to span 5′UTR, CDS and part of 3′UTR of M1‐AQP4 mRNA. The PCR product was transcribed in a capped (m7G5′PPP5′G, similar to the Cap0 structure) mRNA. The capped M1‐AQP4 mRNA was biotinylated to the 3′ end and captured on streptavidin magnetic beads. Spinal cord extracts from M23‐null and WT mice were incubated and eluates identified by LC MS/MS analysis. Negative control RNA coated beads and nude beads were used as control conditions. Eluates from control RNA coated beads were also identified and quantified by MS to identify non‐specific binders, eliminated from the subsequently analysis. (b) Representative SDS‐PAGE and silver staining analysis of spinal cord input and eluates from AQP4‐RNA coated, control‐RNA coated and nude beds. Arrowheads indicate bands specific for AQP4‐RNA coated beads. n = 4 for each genotype. (c) Quantitative differential MS analysis of AQP4‐mRNA eluates in M23‐null versus WT. Only proteins specific for AQP4‐RNA coated beads are shown in the graph. These proteins were identified as M1‐AQP4‐mRNA binders (M1‐AQP4‐RBPs). The quantitative differential analysis of M1‐AQP4‐RBPs abundance in M23‐null and WT mice is shown as the M23‐null/WT ratio. The unchanged proteins are in the range of 1 ± 0.3. The group of M1‐AQP4‐RBPs found to be more abundant in the M23‐null eluates is indicated as upregulated while the group of M1‐AQP4‐RBPs found to be less abundant in the M23‐null eluates is indicated as downregulated. PTBP1 was found to be 2.75‐fold more abundant in KI (M23‐null/WT = 2.75, red highlighted) while DDX17 and CMTR1 were found to be five to six times less abundant in M23‐null (M23‐null/WT = 0.22 for DDX17 and 0.15 for CMTR1, highlighted in red). n = 2 for each genotype, data were obtained using pooled samples. (d) Western blotting analysis of PTBP1 and DDX17 in WT and M23‐null mice spinal cord showed no changes in expression levels of both proteins. n = 7 for each genotype [Color figure can be viewed at wileyonlinelibrary.com]
FIGURE 4
FIGURE 4
Functional validation of DDX17 and PTBP1 in the aquaporin‐4 (AQP4) regulation by RNAi in mouse astrocyte primary cultures. (a) Confocal microscopy analysis of DDX17 (red) expression in control siRNA and DDX17 siRNA‐treated astrocyte primary cultures. The immunofluorescence shows the main localization of DDX17 into the nucleus (N) and a lower dot‐like cytoplasmic staining (C), enlarged in the red boxed area. (b) Wide‐field immunofluorescence analysis of AQP4 (green) and DDX17 (red) shows a strong reduction in DDX17 staining in DDX17 RNAi treated astrocytes and the upregulation of AQP4 compared with control siRNA‐treated astrocytes. (c) Representative Western blotting analysis of astrocytes treated with control and DDX17 siRNA. DDX17 is strongly downregulated while AQP4 expression is upregulated in DDX17 siRNA conditions. n = 9 from three independent astrocytes preparations. (d) Densitometric analysis of Western blotting represented in Panel (c). DDX17 knockdown strongly upregulates AQP4 expression. **p = .005, ***p = .0001, DDX17 siRNA versus CTRL siRNA; n = 9 from three independent astrocytes preparations. Student's t test for unpaired data. (e) Relative quantification of AQP4‐tot and AQP4‐M1 mRNA between control‐ and DDX17‐siRNA‐treated astrocytes obtained by RT‐qPCR from the same samples reported in Panels (c) and (d). No differences were found for either target. n = 9 from three independent astrocyte preparations. Student's t test for unpaired data. (f) ΔCt (Ct AQP4‐tot) ‐ (Ct AQP4‐M1‐AQP4) analysis using cDNA from mouse astrocyte samples (n = 18 from three independent astrocyte preparations). (g,h) Functional validation of PTBP1 in the AQP4 regulation by RNAi in mouse astrocyte primary cultures. Astrocyte primary cultures treated with control and PTBP1 siRNA analyzed by Western blotting (g) and densitometric analysis (h). PTB knockdown strongly reduces AQP4 expression, ***p < .0001, PTBP1 siRNA versus CTRL siRNA; n = 10 from three independent astrocyte preparations. Student's t test for unpaired data. (il) Calcein‐quenching assay for measurement of hypotonicity‐induced volume changes in cultured WT astrocytes treated with scramble siRNA (CTRL) and DDX17 siRNA. (i) Representative time course of cell swelling (swelling phase) followed by regulatory volume decrease (regulatory volume decrease [RVD] phase) recorded from calcein‐loaded cells upon exposure to 60 mOsm/L hypotonic gradient. (l) Histogram showing the means ±ES values of the magnitude of cell swelling and of the extent of volume recovery (in percent) obtained from 14 to 18 measurements of three set of independent experiments. Note that DDX17 knockdown enhanced cell swelling amplitude and the efficiency of RVD. Statistical analysis was performed by t test for unpaired data (**p < .001) [Color figure can be viewed at wileyonlinelibrary.com]
FIGURE 5
FIGURE 5
Searching for M1‐aquaporin‐4 (AQP4) mRNA regulatory elements and protein binding sites. (a) mFOLD prediction of mouse M1‐AQP4 mRNA secondary structure and IRESPred IRES prediction. The most stable structure is reported. The red box highlights the 5′UTR which is potentially able to form a very stable stem‐loop structure containing both M1‐AQP4 and M23‐AQP4 translation initiation signals (TISs). Notably, IRESPred indicates the presence of a potential IRES between nucleotides 132 and 280. (b) Detailed analysis performed using open reading frame (ORF) finder, RBPsite, IRESPred, and QGRS. ORF finder indicates four different potential translation initiations indicated by black arrows. In Position 6, an out of frame upstream AUG (uAUG) was identified. An in‐frame non‐AUG start potentially able to express an N‐terminal extended isoform is present in Position 101. Canonical M1‐AQP4 and M23‐AQP4 start sites are highlighted in Positions 128 and 194. RBPsite predicts three different PTBP1 binding sites and one binding site for HNRNPK/HNRPL. QGRS predicts G‐RNA quadruplexes (blue bi‐planar structures). Note that two G‐RNA quadruplexes in Positions 150–169 and 209–232 are just downstream of M1‐AQP4 and M23‐AQP4 AUG, respectively. Interestingly, the DDX17 binding site represented by the CACACCU sequence is present in positions 535–541. IRESPred indicates the presence of a potential IRES in Positions 132–280 that include two G‐RNA quadruplexes [Color figure can be viewed at wileyonlinelibrary.com]

References

    1. Abe, Y., Ikeshima‐Kataoka, H., Goda, W., Niikura, T., & Yasui, M. (2012). An astrocyte‐specific enhancer of the aquaporin‐4 gene functions through a consensus sequence of POU transcription factors in concert with multiple upstream elements. Journal of Neurochemistry, 120(6), 899–912. 10.1111/j.1471-4159.2012.07652.x - DOI - PubMed
    1. Arora, A., Dutkiewicz, M., Scaria, V., Hariharan, M., Maiti, S., & Kurreck, J. (2008). Inhibition of translation in living eukaryotic cells by an RNA G‐quadruplex motif. RNA, 14(7), 1290–1296. 10.1261/rna.1001708 - DOI - PMC - PubMed
    1. Baird, S. D., Lewis, S. M., Turcotte, M., & Holcik, M. (2007). A search for structurally similar cellular internal ribosome entry sites. Nucleic Acids Research, 35(14), 4664–4677. 10.1093/nar/gkm483 - DOI - PMC - PubMed
    1. Boulay, A. C., Mazare, N., Saubamea, B., & Cohen‐Salmon, M. (2019). Preparing the astrocyte perivascular endfeet transcriptome to investigate astrocyte molecular regulations at the brain‐vascular Interface. Methods in Molecular Biology, 1938, 105–116. 10.1007/978-1-4939-9068-9_8 - DOI - PubMed
    1. Chudinova, E. M., & Nadezhdina, E. S. (2018). Interactions between the translation machinery and microtubules. Biochemistry (Mosc), 83(Suppl 1), S176–S189. 10.1134/S0006297918140146 - DOI - PubMed

Publication types