

Genetic associations for two biological age measures point to distinct aging phenotypes
- PMID: 34038024
- PMCID: PMC8208797
- DOI: 10.1111/acel.13376
Genetic associations for two biological age measures point to distinct aging phenotypes
Abstract
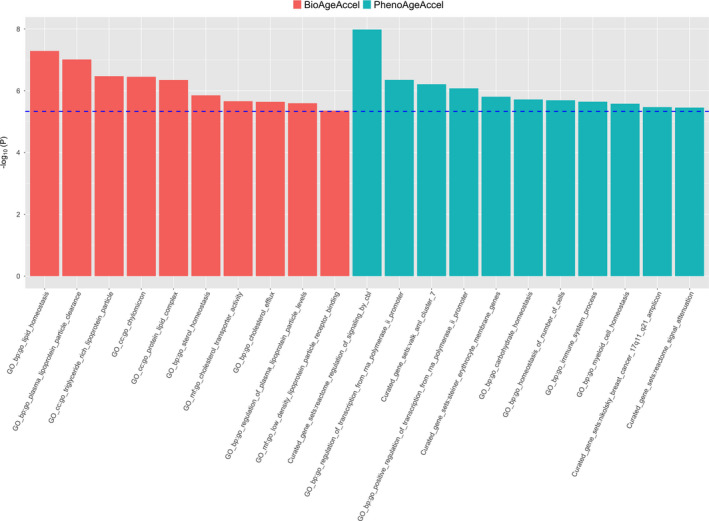
Biological age measures outperform chronological age in predicting various aging outcomes, yet little is known regarding genetic predisposition. We performed genome-wide association scans of two age-adjusted biological age measures (PhenoAgeAcceleration and BioAgeAcceleration), estimated from clinical biochemistry markers (Levine et al., 2018; Levine, 2013) in European-descent participants from UK Biobank. The strongest signals were found in the APOE gene, tagged by the two major protein-coding SNPs, PhenoAgeAccel-rs429358 (APOE e4 determinant) (p = 1.50 × 10-72 ); BioAgeAccel-rs7412 (APOE e2 determinant) (p = 3.16 × 10-60 ). Interestingly, we observed inverse APOE e2 and e4 associations and unique pathway enrichments when comparing the two biological age measures. Genes associated with BioAgeAccel were enriched in lipid related pathways, while genes associated with PhenoAgeAccel showed enrichment for immune system, cell function, and carbohydrate homeostasis pathways, suggesting the two measures capture different aging domains. Our study reaffirms that aging patterns are heterogeneous across individuals, and the manner in which a person ages may be partly attributed to genetic predisposition.
Keywords: APOE; biomarkers; cardiac aging; inflammaging; polygenic risk score.
© 2021 The Authors. Aging Cell published by the Anatomical Society and John Wiley & Sons Ltd.
Conflict of interest statement
MEL is named on patent applications for epigenetic clocks and holds licenses for the clocks she has developed. MEL also serves as the Bioinformatics Advisor for Elysium Health.
Figures


Update of
-
Genetic associations for two biological age measures point to distinct aging phenotypes.medRxiv [Preprint]. 2020 Jul 12:2020.07.10.20150797. doi: 10.1101/2020.07.10.20150797. medRxiv. 2020. Update in: Aging Cell. 2021 Jun;20(6):e13376. doi: 10.1111/acel.13376. PMID: 32676622 Free PMC article. Updated. Preprint.
References
-
- An, P. , Miljkovic, I. , Thyagarajan, B. , Kraja, A. T. , Daw, E. W. , Pankow, J. S. , Selvin, E. , Kao, W. H. L. , Maruthur, N. M. , Nalls, M. A. , Liu, Y. , Harris, T. B. , Lee, J. H. , Borecki, I. B. , Christensen, K. , Eckfeldt, J. H. , Mayeux, R. , Perls, T. T. , Newman, A. B. , & Province, M. A. (2014). Genome‐wide association study identifies common loci influencing circulating glycated hemoglobin (HbA1c) levels in non‐diabetic subjects: The Long Life Family Study (LLFS). Metabolism, 63(4), 461–468. - PMC - PubMed
-
- Atkins, J. L. , Jylhava, J. , Pedersen, N. , Magnusson, P. , Lu, Y. , Wang, Y. , Hagg, S. , Melzer, D. , Williams, D. , & Pilling, L. C. (2019). A Genome‐Wide Association Study of the Frailty Index Highlights Synaptic Pathways in Aging. medRxiv, 19007559. Available at: http://medrxiv.org/content/early/2019/09/25/19007559.abstract - PMC - PubMed
-
- Belsky, D. W. , Moffitt, T. E. , Cohen, A. A. , Corcoran, D. L. , Levine, M. E. , Prinz, J. A. , Schaefer, J. , Sugden, K. , Williams, B. , Poulton, R. , & Caspi, A. (2018). Eleven telomere, epigenetic clock, and biomarker‐composite quantifications of biological aging: do they measure the same thing? American Journal of Epidemiology, 187(6), 1220–1230. - PMC - PubMed
-
- Bulik‐Sullivan, B. K. , Loh, P.‐R. , Finucane, H. K. , Ripke, S. , Yang, J. , Consortium SWG of the PG , Patterson, N. , Daly, M. J. , Price, A. L. , & Neale, B. M. (2015) LD Score regression distinguishes confounding from polygenicity in genome‐wide association studies. Nature Genetics, 47(3), 291–295. - PMC - PubMed
Publication types
MeSH terms
Grants and funding
LinkOut - more resources
Full Text Sources
Other Literature Sources
Medical
Miscellaneous
