Review
. 2021 May;129(5):57012.
doi: 10.1289/EHP8419. Epub 2021 May 26.

Breast Cancer Risk in Association with Atmospheric Pollution Exposure: A Meta-Analysis of Effect Estimates Followed by a Health Impact Assessment

Affiliations
Review

Breast Cancer Risk in Association with Atmospheric Pollution Exposure: A Meta-Analysis of Effect Estimates Followed by a Health Impact Assessment

Stephan Gabet et al. Environ Health Perspect. 2021 May.

Abstract

Background: The epidemiological literature of associations between atmospheric pollutant exposure and breast cancer incidence has recently strongly evolved.

Objectives: We aimed to perform a) a meta-analysis of studies considering this relationship, correcting for publication bias and taking menopausal status and cancer hormone responsiveness into account; and b) for the pollutants most likely to affect breast cancer, an assessment of the corresponding number of attributable cases in France and of the related economic costs.

Methods: We conducted a literature review and random-effects meta-analyses of epidemiological studies examining the association of fine particulate matter with aerodynamic diameter less than or equal to 2.5μm (PM2.5), particulate matter with aerodynamic diameter less than or equal to 10 μm (PM10), and NO2 long-term exposure with breast cancer incidence; additional analyses were stratified on menopausal status and on tumor hormone responsiveness status. The resulting dose-response functions were combined with modeled atmospheric pollutant exposures in 2013 for France, cancer treatments costs, lost productivity, and years of life lost, to estimate the number of breast cancers attributable to atmospheric pollution and related economic costs in France.

Results: The review identified 32, 27, and 36 effect estimates for PM2.5, PM10, and NO2, respectively. The meta-analytical relative risk estimates of breast cancer corrected for publication bias were 1.006 [95% confidence interval (CI): 0.941, 1.076], 1.047 (95% CI: 0.984, 1.113), and 1.023 (95% CI: 1.005, 1.041), respectively. NO2 estimated effects appeared higher in premenopausal than in postmenopausal women and higher for hormone responsive positive (ER+/PR+) than negative (ER-/PR-) breast cancers. Assuming a causal effect of NO2, we estimated that 1,677 (95% CI: 374, 2,914) new breast cancer cases were attributable to NO2 annually in France, or 3.15% (95% CI: 0.70, 5.48) of the incident cases. The corresponding tangible and intangible costs were estimated to be €825 million (low, high: 570, 1,080) per year.

Conclusion: These findings suggest that decreasing long-term NO2 exposure or correlated air pollutant exposures could lower breast cancer risk. https://doi.org/10.1289/EHP8419.


Figures

Figure 1 is a forest plot, plotting Study name from bottom to top, meta-analytical risk corrected for publication bias, meta-analytical risk, European Prospective Investigation into Cancer and Nutrition–Oxford, Cardiovascular Effects of Air pollution and Noise in Stockholm, Oslo Health Study, Diet, Cancer and Health, European Prospective Investigation into Cancer and Nutrition-Turin, Breast cancer: epidemiological study on the environment in Côte d’Or and Ille-et-Vilaine, Sister Study, Multiethnic Cohort, Ontario Population Health and Environment Cohort, Canadian National Breast Screening Study, Danish Nurse Cohort, Nurses’ Health Study 2 cohort, European Prospective Investigation into Cancer and Nutrition- Netherlands, and Vorarlberg Health Monitoring and Prevention Program (y-axis) across exposure, ranging from 0.3 to 0.5 in increments of 0.2, 0.5 to 1 in increments of 0.5, and 1 to 3 in unit increments (x-axis) for Risk ratio (95 percent confidence intervals) and percentage of weight.
Figure 1.
Random-effects meta-analytical relative risk of breast cancer incidence associated with a 10-μg/m3 increase in exposure to particulate matter with an aerodynamic diameter below 2.5μm (PM2.5; Ncases=111,758, Nparticipants=2,959,079). Note: CEANS, Cardiovascular Effects of Air Pollution and Noise in Stockholm; CECILE, Breast Cancer: Epidemiological Study on the Environment in Côte d’Or and Ille-et-Vilaine; CNBSS, Canadian National Breast Screening Study; DCH: Diet, Cancer and Health; DNC, Danish Nurse Cohort; EPIC, European Prospective Investigation into Cancer and Nutrition; HUBRO, Oslo Health Study; MEC, Multiethnic Cohort; NHSII, Nurses’ Health Study II cohort; ONPHEC, Ontario Population Health and Environment Cohort; VHM&PP, Vorarlberg Health Monitoring and Prevention Program.
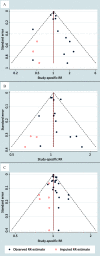
Figures 2A to 2C are funnel plots, plotting Standard error, ranging from 1 to 0 in decrements of 0.2; 0.4 to 0 in decrements 0.009; and 0.4 to 1 in decrements 0.009 (y-axis) across study-specific risk ratio, ranging from 0.2 to 0.5 in increments of 0.3, 0.5 to 1 in increments of 0.5, 1 to 2 in unit increments, and 2 to 6 in increments of 4; 0.5 to 1 in increments of 0.5 and 1 to 2 in unit increments; and 0.5 to 1 in increments of 0.5 and 1 to 2 in unit increments (x-axis) for observed risk ratio estimate and imputed risk ratio estimate, respectively.
Figure 2.
Funnel plots of the study-specific estimates of breast cancer relative risk associated with a 10-μg/m3 increase in exposure to (A) particulate matter with an aerodynamic diameter below 2.5  μg/m3 (PM2.5), (B) particulate matter with an aerodynamic diameter below 10  μg/m3 (PM10), and (C) nitrogen dioxide (NO2). Black solid dots: study-specific relative risk estimates identified by the literature review and included in the meta-analysis; red hollow dots: imputed relative risk estimates by trim-and-fill analysis necessary to observe a symmetrical funnel plot; vertical lines: meta-analytical relative risk estimates based on fixed-effects meta-analysis, before, in black solid line, and after, in red dotted line, trim-and-fill analysis (fixed-effects, that assume no between-study heterogeneity, are required to assess potential for publication bias).
Figure 3 is a forest plot, plotting Study name from bottom to top, meta-analytical risk corrected for publication bias, meta-analytical risk, Oslo Health Study, European Prospective Investigation into Cancer and Nutrition-Turin, European Prospective Investigation into Cancer and Nutrition–Oxford, Statutory health insurance database in Saxony, Breast cancer: epidemiological study on the environment in Côte d’Or and Ille-et-Vilaine, Diet, Cancer and Health, Danish Nurse Cohort, Multiethnic Cohort, Cardiovascular Effects of Air pollution and Noise in Stockholm, Sister Study, Nurses’ Health Study 2 cohort, European Prospective Investigation into Cancer and Nutrition- Netherlands, and Vorarlberg Health Monitoring and Prevention Program (y-axis) across exposure, ranging from 0.7 to 1 in increments of 0.3, 1 to 1.5 in increments of 0.5, and 1.5 to 2 in increments of 0.5 (x-axis) for Risk ratio (95 percent confidence intervals) and percentage of weight. Figure 3 is a forest plot, plotting Study name from bottom to top, meta-analytical risk corrected for publication bias, meta-analytical risk, Oslo Health Study, European Prospective Investigation into Cancer and Nutrition-Turin, European Prospective Investigation into Cancer and Nutrition–Oxford, Statutory health insurance database in Saxony, Breast cancer: epidemiological study on the environment in Côte d’Or and Ille-et-Vilaine, Diet, Cancer and Health, Danish Nurse Cohort, Multiethnic Cohort, Cardiovascular Effects of Air pollution and Noise in Stockholm, Sister Study, Nurses’ Health Study 2 cohort, European Prospective Investigation into Cancer and Nutrition- Netherlands, and Vorarlberg Health Monitoring and Prevention Program (y-axis) across exposure, ranging from 0.7 to 1 in increments of 0.3, 1 to 1.5 in increments of 0.5, and 1.5 to 2 in increments of 0.5 (x-axis) for Risk ratio (95 percent confidence intervals) and percentage of weight.
Figure 3.
Random-effects meta-analytical relative risk of breast cancer incidence associated with a 10-μg/m3 increase in exposure to particulate matter with an aerodynamic diameter below 10μm (PM10; Ncases=23,765, Nparticipants=1,326,524). Note: AOK PLUS, Statutory Health Insurance Database in Saxony; CEANS, Cardiovascular Effects of Air pollution and Noise in Stockholm; CECILE, Breast Cancer: Epidemiological Study on the Environment in Côte d’Or and Ille-et-Vilaine; DCH, Diet, Cancer and Health; DNC, Danish Nurse Cohort; EPIC, European Prospective Investigation into Cancer and Nutrition; HUBRO, Oslo Health Study; MEC, Multiethnic Cohort; NHSII, Nurses’ Health Study II cohort; VHM&PP, Vorarlberg Health Monitoring and Prevention Program.
Figure 4 is a forest plot, plotting Study name from bottom to top, meta-analytical risk corrected for publication bias, meta-analytical risk, Case-control study for postmenopausal breast cancer in Montreal 1, Oslo Health Study, Cardiovascular Effects of Air pollution and Noise in Stockholm, European Prospective Investigation into Cancer and Nutrition- San Sebastian, Breast cancer: epidemiological study on the environment in Côte d’Or and Ille-et-Vilaine, European Prospective Investigation into Cancer and Nutrition- Umea, Canadian National Breast Screening Study underscore Breast cancer relative risk estimates from Canadian National Breast Screening Study, reported separately in premenopausal women, Case-control study for postmenopausal breast cancer in Montreal 2, Statutory health insurance database in Saxony, European Prospective Investigation into Cancer and Nutrition-Varese, Sister Study, European Prospective Investigation into Cancer and Nutrition-Turin, National Enhanced Cancer Surveillance System, Diet, Cancer and Health, Danish Nurse Cohort, Multiethnic Cohort, European Prospective Investigation into Cancer and Nutrition- Netherlands, Ontario Population Health and Environment Cohort, European Prospective Investigation into Cancer and Nutrition-Oxford, Danish Nurse Cohort, Canadian National Breast Screening Study underscore Breast cancer relative risk estimates from Canadian National Breast Screening Study, reported separately in postmenopausal women, Vorarlberg Health Monitoring and Prevention Program, and European Prospective Investigation into Cancer and Nutrition- E 3 N (y-axis) across exposure, ranging from 0.8 to 1 in increments of 0.009 and 1 to 1.4 in increments of 0.2 (x-axis) Risk ratio (95 percent confidence intervals) and percentage of weight.
Figure 4.
Random-effects meta-analytical relative risk of breast cancer incidence associated with a 10-μg/m3 increase in exposure to nitrogen dioxide (NO2; Ncases=121,189, Nparticipants=3,922,395). Breast cancer relative risk estimates from CNBSS, reported separately in premenopausal women (“CNBSS_pre”) and postmenopausal women (“CNBSS_post”). Note: AOK PLUS, Statutory Health Insurance Database in Saxony; CCSPBCM1, Case-control Study for Postmenopausal Breast Cancer in Montreal 1; CCSPBCM2, Case–control Study for Postmenopausal Breast Cancer in Montreal 2; CEANS, Cardiovascular Effects of Air pollution and Noise in Stockholm; CECILE, Breast Cancer: Epidemiological Study on the Environment in Côte d’Or and Ille-et-Vilaine; CNBSS, Canadian National Breast Screening Study; DCH, Diet, Cancer and Health; DNC, Danish Nurse Cohort; EPIC, European Prospective Investigation into Cancer and Nutrition; HUBRO, Oslo Health Study; MEC, Multiethnic Cohort; NECSS, National Enhanced Cancer Surveillance System; ONPHEC, Ontario Population Health and Environment Cohort; VHM&PP, Vorarlberg Health Monitoring and Prevention Program.
Figures 5A to 5C are maps of France, indicating annual average concentration levels. Figures 5A displays the range of particulate matter with an aerodynamical diameter below 2.5 micrograms per meter cubed that is divided into ten parts: 9.9 to 11.3, 11.3 to 12.0, 12.0 to 12.6, 12.6 to 13.2, 13.2 to 13.7, 13.7 to 14.3, 14.3 to 15.0, 15.0 to 16.0, 16.0 to 17.9, and 17.9 to 21.0. A scale depicts kilometers ranging from 0 to 200 in increments of 100. Figure 5B displays the range of particulate matter with an aerodynamical diameter below 10 micrograms per meter cubed that is divided into ten parts: 12.1 to 16.2, 16.2 to 17.3, 17.3 to 18.1, 18.1 to 18.9, 18.9 to 19.7, 19.7 to 20.5, 20.5 to 21.5, 21.5 to 22.8, 22.8 to 24.8, and 24.8 to 29.8. A scale depicts kilometers ranging from 0 to 200 in increments of 100. Figure 5C displays a range of concentration levels of nitrogen dioxide that is divided into the following ten parts: 0.0 to 3.8, 3.8 to 6.0, 6.0 to 7.8, 7.8 to 9.6, 9.6 to 11.7, 11.7 to 14.4, 14.4 to 17.7, 17.7 to 22.6, 22.6 to 30.7, and 30.7 to 43.3. A scale depicts kilometers ranging from 0 to 200 in increments of 100.
Figure 5.
Annual average concentration levels of (A) particulate matter with an aerodynamic diameter below 2.5  μg/m3 (PM2.5), (B) particulate matter with an aerodynamic diameter below 10  μg/m3 (PM10), and (C) nitrogen dioxide (NO2), in France, in 2013. Data at the 1-km2 spatial resolution, from the national air pollution model developed by the French National Institute for Industrial Environment and Risks (Ineris) (Benmerad et al. 2017a).

Comment in

References

    1. Akram M, Iqbal M, Daniyal M, Khan AU. 2017. Awareness and current knowledge of breast cancer. Biol Res 50(1):33, PMID: 28969709, 10.1186/s40659-017-0140-9. - DOI - PMC - PubMed
    1. Alfano R, Herceg Z, Nawrot TS, Chadeau-Hyam M, Ghantous A, Plusquin M. 2018. The impact of air pollution on our epigenome: how far is the evidence? (a systematic review). Curr Environ Health Rep, PMID: 30361985, 10.1007/s40572-018-0218-8. - DOI - PubMed
    1. Andersen ZJ, Ravnskjær L, Andersen KK, Loft S, Brandt J, Becker T, et al. . 2017a. Long-term exposure to fine particulate matter and breast cancer incidence in the danish nurse cohort study. Cancer Epidemiol Biomarkers Prev 26(3):428–430, PMID: 27913396, 10.1158/1055-9965.EPI-16-0578. - DOI - PubMed
    1. Andersen ZJ, Stafoggia M, Weinmayr G, Pedersen M, Galassi C, Jørgensen JT, et al. . 2017b. Long-Term exposure to ambient air pollution and incidence of postmenopausal breast cancer in 15 European cohorts within the ESCAPE project. Environ Health Perspect 125(10):107005, PMID: 29033383, 10.1289/EHP1742. - DOI - PMC - PubMed
    1. Apostolou P, Fostira F. 2013. Hereditary breast cancer: the era of new susceptibility genes. BioMed Res Int 2013:747318, PMID: 23586058, 10.1155/2013/747318. - DOI - PMC - PubMed