. 2021 May 26;19(5):e3001259.
doi: 10.1371/journal.pbio.3001259. eCollection 2021 May.

Chemokines act as phosphatidylserine-bound "find-me" signals in apoptotic cell clearance

Affiliations

Chemokines act as phosphatidylserine-bound "find-me" signals in apoptotic cell clearance

Sergio M Pontejo et al. PLoS Biol. .

Abstract

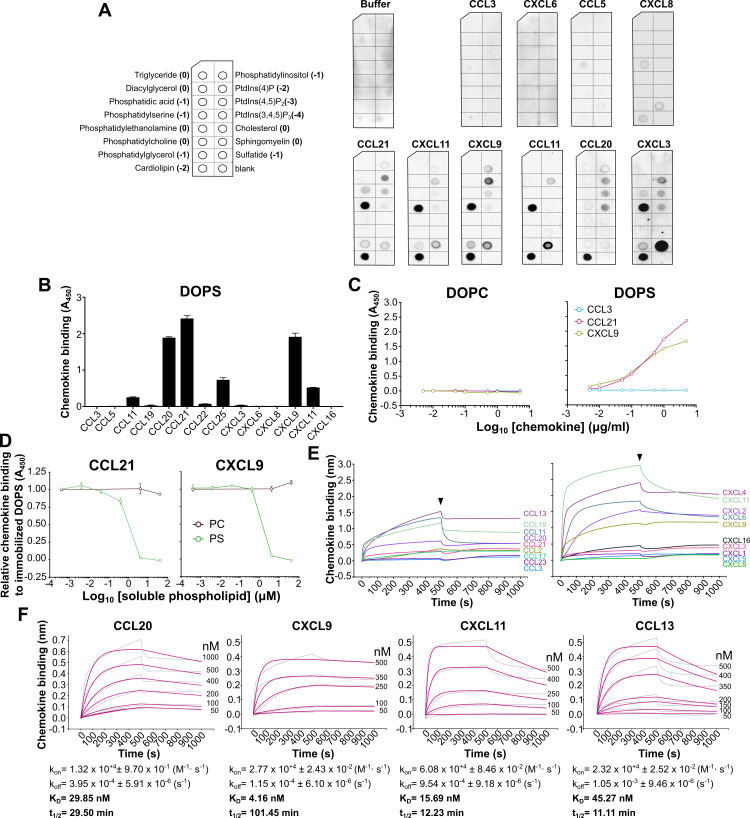
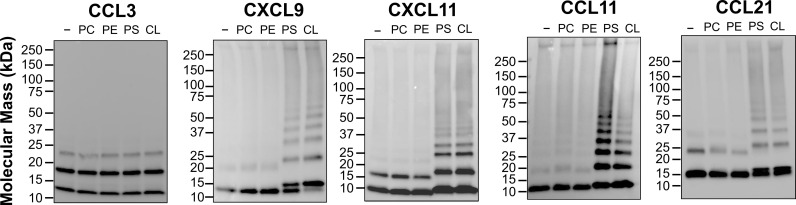
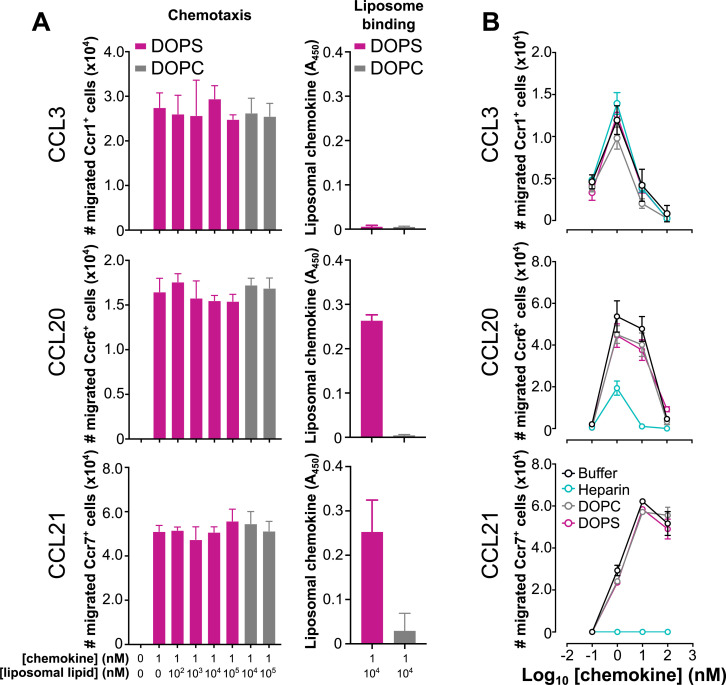
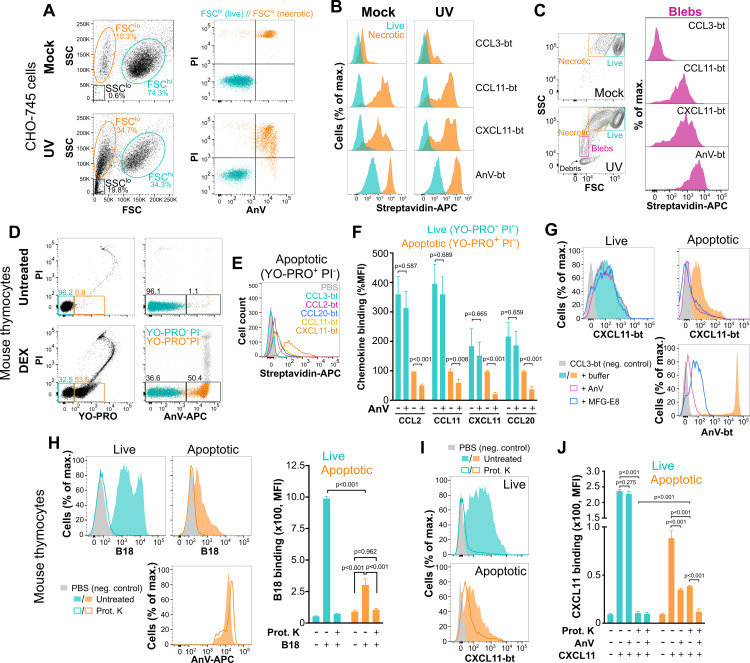
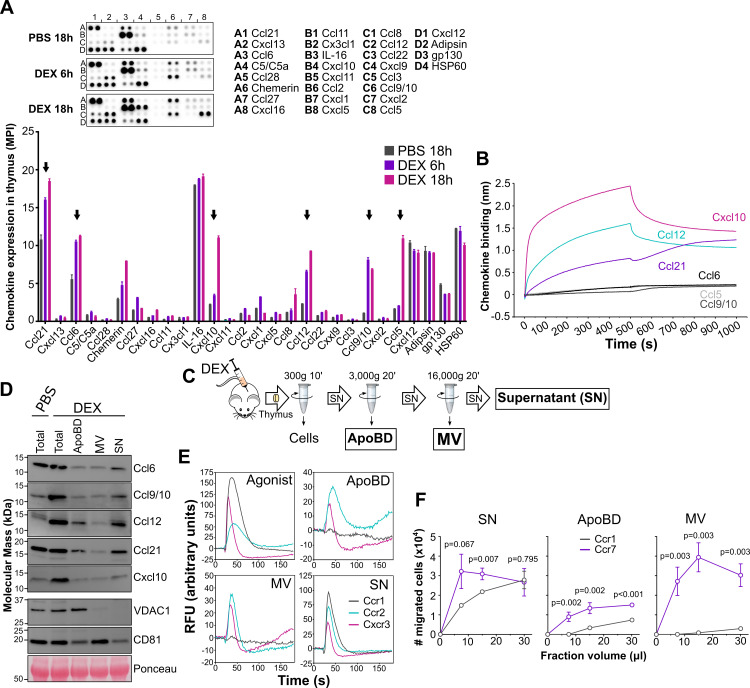
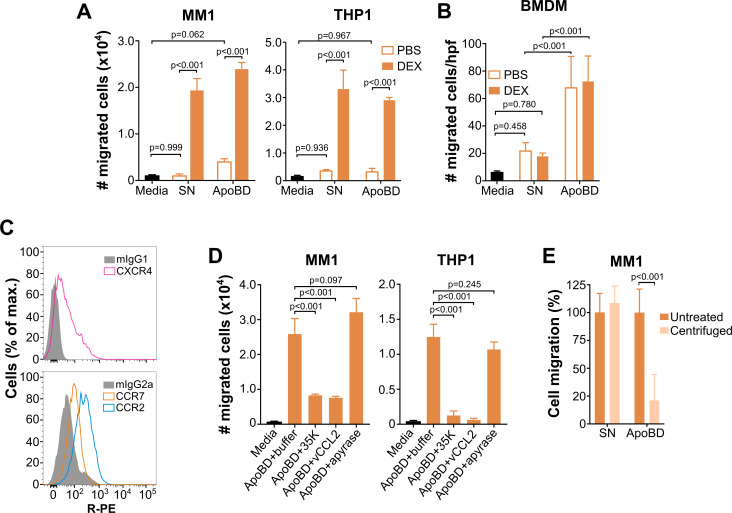
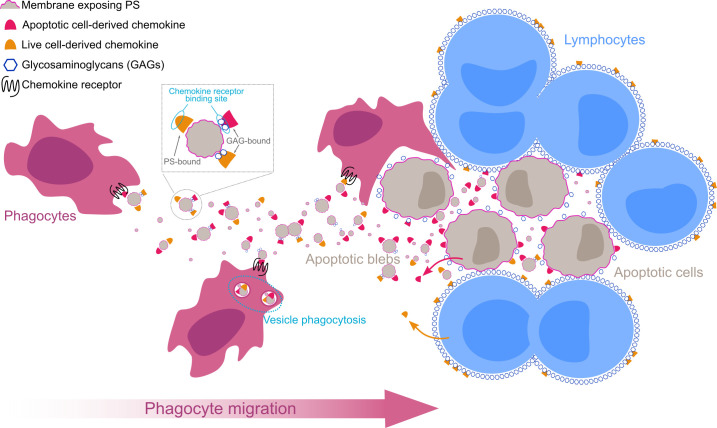
Removal of apoptotic cells is essential for maintenance of tissue homeostasis. Chemotactic cues termed "find-me" signals attract phagocytes toward apoptotic cells, which selectively expose the anionic phospholipid phosphatidylserine (PS) and other "eat-me" signals to distinguish healthy from apoptotic cells for phagocytosis. Blebs released by apoptotic cells can deliver find-me signals; however, the mechanism is poorly understood. Here, we demonstrate that apoptotic blebs generated in vivo from mouse thymus attract phagocytes using endogenous chemokines bound to the bleb surface. We show that chemokine binding to apoptotic cells is mediated by PS and that high affinity binding of PS and other anionic phospholipids is a general property of many but not all chemokines. Chemokines are positively charged proteins that also bind to anionic glycosaminoglycans (GAGs) on cell surfaces for presentation to leukocyte G protein-coupled receptors (GPCRs). We found that apoptotic cells down-regulate GAGs as they up-regulate PS on the cell surface and that PS-bound chemokines, unlike GAG-bound chemokines, are able to directly activate chemokine receptors. Thus, we conclude that PS-bound chemokines may serve as find-me signals on apoptotic vesicles acting at cognate chemokine receptors on leukocytes.


Conflict of interest statement

The authors have declared that no competing interests exist.

Figures

Fig 1
Fig 1. Chemokines bind to anionic phospholipids.
The phospholipid-binding activity of chemokines was studied by protein–lipid overlay (A), ELISA (B–D), and BLI (E, F). (A) Arrays spotted with 15 different phospholipids (left panel; in parentheses, net charge of each phospholipid) were incubated with buffer or 0.1 μg/ml of the indicated chemokines. Bound chemokine was detected with specific antibodies. Results are representative of 2–3 experiments for each chemokine. (B) Human chemokines indicated on the x-axis were incubated at 1 μg/ml in wells containing immobilized DOPS liposomes. Bound chemokine was detected with specific antibodies for each chemokine, and the absorbance at 450 nm (A450) was calculated in a microplate reader. Data are presented as mean ± SD chemokine binding of triplicate A450 determinations in one experiment representative of 2 independent experiments. (C) Increasing concentrations of CCL3, CCL21, or CXCL9 were incubated in wells containing immobilized DOPC (left) or DOPS (right) liposomes. Bound chemokine was detected as in B. Data are presented as mean ± SD of triplicates from one experiment representative of 3 independent experiments. (D) Increasing concentrations of the soluble phospholipids indicated in the inset of the right panel were preincubated with 0.5 μg/ml of CCL21 (left) or CXCL9 (right). The chemokine–lipid mix was then added into wells containing immobilized DOPS liposomes, and liposome-bound chemokine was detected as in B. Chemokine binding data are presented as the mean ± SD of triplicate A450 determinations relative to the A450 recorded in the absence of competing phospholipid and are representative of 3 independent experiments. (E) Chemokine–PS binding screen by BLI. Biosensors immobilized with DOPS liposomes were incubated with 1 μM of the indicated human CC (left panel) and CXC (right panel) chemokines color-coded on the right side of each curve. The binding response in nm (y-axis) over time (x-axis) for each chemokine is shown. The binding of each chemokine to biosensors coated with DOPC liposomes was used as reference and subtracted from the corresponding binding curve. Black arrowheads point to the beginning of the dissociation phase. (F) Kinetic analysis. Selected chemokines (indicated above each panel) were incubated at the concentrations indicated to the right of each curve with biosensors coated with DOPS liposomes. Binding of each chemokine concentration to reference DOPC biosensors was subtracted. The obtained binding curves (gray) were globally fitted to a 1:1 Langmuir model (magenta curves), and the association (kon), dissociation (koff), and affinity (KD) constants were calculated. The half-life (t1/2) for each interaction was calculated as t1/2 = ln(2)/koff. The underlying numerical values for the panels displaying summary numerical data can be found in S1 Data. BLI, biolayer interferometry.
Fig 2
Fig 2. Anionic phospholipids induce oligomerization of PS-binding chemokines.
The chemokines (50 ng) indicated above each panel were incubated in the absence or presence of the phospholipids (1:8, chemokine:lipid molar ratio) indicated above each lane (−, no lipid) with the cross-linker BS3. Samples were analyzed by SDS-PAGE and immunoblot using specific anti-chemokine antibodies. Molecular mass markers are shown in kDa on the left of each panel. Data are representative of 2 independent experiments for each chemokine. CL, cardiolipin; PC, phosphatidylcholine; PE, phosphatidylethanolamine; PS, phosphatidylserine.
Fig 3
Fig 3. Chemokine interaction with liposomal PS does not affect chemotactic activity.
(A) DOPS liposomes do not impair chemokine chemotactic activity. Left column: “Chemotaxis.” The chemokines indicated on the left side of each graph row were preincubated for 30 minutes at room temperature with biotinylated DOPS (magenta) or DOPC (gray) liposomes at the concentrations indicated below the x-axis. Then, chemotactic activity of the mixture was tested using L1.2 reporter cells, stably expressing the mouse receptors Ccr1 (for CCL3), Ccr6 (for CCL20), and Ccr7 (for CCL21) as indicated on the y-axis. Bars correspond to the total number of migrated cells after 3–4 hours at 37°C for each chemokine–liposome mix or buffer alone (0:0, chemokine:liposome). Right column: “Liposome binding.” CCL20 and CCL21 but not CCL3, bound to DOPS liposomes under the experimental conditions used for the chemotaxis assays. Liposome-bound chemokine was detected by ELISA. A total of 50 μl of the 1:104 chemokine:liposome molar ratio mix of each chemokine with biotinylated DOPS or DOPC liposomes (as indicated in the inset of the top graph) were incubated in streptavidin-coated wells. After washing, liposome-bound chemokine was detected by specific antibodies, and A450 was calculated in a microplate reader. All data are presented as mean ± SD of triplicates from one experiment representative of 3 independent experiments. (B) Anionic GAGs but not PS-containing liposomes inhibit the chemotactic activity of CCL20 and CCL21. Increasing concentrations (0.1–100 nM) of CCL3, CCL20, and CCL21 (as indicated on the left side of each graph) were preincubated for 30 minutes at room temperature with buffer alone (black), or a 104-fold molar excess of DOPC liposomes (gray) or DOPS liposomes (magenta), or a 103-fold molar excess of heparin (cyan), as indicated in the inset of the bottom graph. Chemotactic activity for each condition is presented as the mean ± SD number of migrated cells of triplicates from one experiment representative of 2–3 independent experiments. The underlying numerical values for the panels displaying summary numerical data can be found in S1 Data. GAG, glycosaminoglycan; PS, phosphatidylserine.
Fig 4
Fig 4. PS-binding chemokines exploit membrane-exposed PS to interact with the surface of dying cells and apoptotic blebs.
As indicated on the left side of each panel row, panels A–C and D–J correspond to analysis based on GAG-deficient CHO-745 cells and mouse thymocytes, respectively. (A) FACS analysis and gating of mock- and UV-irradiated CHO-745 cells. FSC–SSC dot plots are shown in the left column. Gates for FSClo necrotic cells, FSChi live cells, and SSClo blebs are shown in orange, cyan, and black, respectively. In the right column, dot plots for AnV and PI staining of FSClo necrotic and FSChi live populations are colored corresponding to their gates in the left column. (B, C) Binding of the indicated bt proteins to necrotic (orange) and live (cyan) cells from mock and UV-irradiated CHO-745 cells in B, or to blebs (magenta) in C, detected with streptavidin-APC (x-axis). In C, left column, are log SSC/FSC contour plots (5% level plus outliers) of mock- and UV-treated cells, showing the gates of live (cyan) and necrotic (orange) CHO-745 cells, and the gate of blebs (magenta) included in the binding analysis in the right column. (D) PI/YO-PRO (left column) and PI/AnV (right column) dot plots of freshly isolated mouse thymocytes (untreated) or incubated ex vivo with 1 μM DEX. In the left column, gates for YO-PROPI (blue, live cells) and YO-PRO+PI (orange, apoptotic cells) cells are shown, and their PI/AnV profile is represented in the right column with events colored according to their PI/YO-PRO staining. Numbers above each gate indicate % of total events. (E) PS-binding chemokines bind apoptotic thymocytes. Representative FACS histograms of the binding of PBS alone or the bt chemokines color-coded in the inset to early apoptotic cells (YO-PRO+ PI) from DEX-treated mouse thymocytes. (F) AnV partially competes chemokine binding to apoptotic thymocytes. Quantification of the MFI of the binding of the indicated bt chemokines to live cells (YO-PROPI, cyan) or early apoptotic cells (YO-PRO+PI, orange) from DEX-treated mouse thymocytes in the absence or presence of unlabeled AnV as indicated on the x-axis. All binding data points (n = 4–6) generated for each chemokine in 3 independent experiments were combined and represented as % MFI relative to the binding of each chemokine to apoptotic thymocytes in the absence of AnV, which was set at 100%. Bars represent mean ± SEM % MFI. p-Values from multiple t tests with Holm–Sidak correction for multiple comparisons are indicated. (G) Binding of bt CCL3 (solid gray), or CXCL11 and AnV (as indicated on the x-axis of each graph) in the presence of buffer (solid-colored histograms) or unlabeled AnV (open magenta) or MFG-E8 (open blue), as indicated in the legend, to live or early apoptotic thymocytes as indicated above each graph column. In E, F, and G, binding of bt proteins was detected with streptavidin-APC. (H) Cell surface GAGs are severely depleted in apoptotic thymocytes. Analysis of cell surface GAGs based on the cell-binding activity of the specific GAG-binding protein B18 on DEX-treated thymocytes. The FACS graphs on the left show the binding of PBS alone (solid gray), recombinant His-tagged B18 (200 nM) and AnV-APC (as indicated on the x-axis of each graph) to live or apoptotic thymocytes (as indicated above each graph column) treated (open-colored histograms) or not (solid-colored histograms) with Prot. K to remove cell surface GAGs. B18 binding was detected with an anti-His mAb. The bar graph on the right shows the quantification of the binding of B18 to live (cyan) and apoptotic (orange) thymocytes treated or not with Prot. K as indicated below the x-axis. Bars represent the mean ± SD MFI of triplicates. Results are from one experiment representative of 2 independent experiments. (I) The PS-binding chemokine CXCL11 binds to GAG-free apoptotic thymocytes. FACS graphs showing the binding of PBS alone (solid gray) or bt CXCL11 (500 nM) to live (cyan) or apoptotic (orange) DEX-treated thymocytes treated (open-colored histograms) or not (solid-colored histograms) with Prot. K to remove cell surface GAGs. (J) Quantification of the binding of CXCL11 to live (cyan) and apoptotic (orange) thymocytes treated or not with Prot. K and in the presence or absence of unlabeled AnV as indicated below the x-axis. Bars represent the mean ± SD MFI of triplicates. Results are from one experiment representative of 2 independent experiments. Chemokine binding in I and J was detected as in panels E, F, and G. p-Values in panels H and J are from a 2-way ANOVA test with Tukey correction for multiple comparisons. The underlying numerical values for the panels displaying summary numerical data can be found in S1 Data. AnV, annexin V; bt, biotinylated; DEX, dexamethasone; FACS, fluorescence-activated cell sorting; FSC, forward scatter; GAG, glycosaminoglycan; MFI, median fluorescence intensity; PI, propidium iodide; Prot. K, proteinase K; PS, phosphatidylserine; SSC, side scatter; UV, ultraviolet.
Fig 5
Fig 5. Endogenous PS-binding chemokines presented on the surface of apoptotic blebs in vivo activate cognate GPCRs.
(A) Endogenous chemokine expression in the thymus of DEX-treated mice. Top, anti-chemokine antibody array membranes were incubated with 200 μg of total protein of mouse thymus extracts collected 6 hours or 18 hours after i.p. injection with PBS or DEX. The membranes are spotted in duplicate with capture antibodies for the chemokines indicated on the right side (position coordinates are indicated with lettered rows and numbered columns). Positions D2 (Adipsin), D3 (gp130), and D4 (HSP60) correspond to loading controls. Bottom, mean ± SD of the MPI for each chemokine. Black arrows point to highly DEX-induced chemokines. (B) BLI analysis of the binding of mouse Ccl5, Ccl6, Ccl9/10, Ccl12, Cxcl10, and Ccl21 (500 nM) to DOPS liposomes. Final binding sensorgrams were generated after subtraction of the binding recorded on DOPC sensors used as reference. (C) Schematic representation of the centrifugation steps followed to isolate ApoBDs, MVs, and the final cleared SN from mouse thymus homogenates. (D) Western blot analysis of Ccl6, Ccl9/10, Ccl12, Ccl21, and Cxcl10 and VDAC1 and CD81 as vesicle markers, in ApoBD, MV, and SN fractions isolated from thymus 18 hours after i.p. injection of mice with PBS or DEX. “Total” lane corresponds to the initial cell-free SN. Blot ponceau staining is shown as loading control. (E, F) Functional assays using ApoBD, MV, and SN fractions isolated from mouse thymus 18 hours after i.p. DEX injection. (E) Calcium flux assays using L1.2 reporter cell lines expressing Ccr1, Ccr2, and Cxcr3 (as indicated in the inset of the “SN” panel). The panel labeled “Agonist” shows the calcium flux response after addition of 50 nM of a known recombinant chemokine agonist for each receptor (Ccl9/10 for Ccr1, Ccl12 for Ccr2, and Cxcl10 for Cxcr3). Calcium flux recordings correspond to the mean of duplicates from one experiment representative of 3 independent experiments. (F) Chemotaxis assays using reporter cell lines expressing Ccr1 and Ccr7 (as indicated in the inset of the “ApoBD” panel) and increasing volumes (x-axis) of the indicated fractions. Data are the mean ± SD of the number of migrated cells of triplicates from one experiment representative of 3 independent experiments. p-Values from multiple t tests corrected for multiple comparisons by the Holm–Sidak method are indicated for each volume data point. The underlying numerical values for the panels displaying summary numerical data can be found in S1 Data. ApoBD, apoptotic body; BLI, biolayer interferometry; DEX, dexamethasone; GPCR, G protein–coupled receptor; i.p., intraperitoneal; MPI, mean pixel intensity; MV, microvesicle; PS, phosphatidylserine; RFU, relative fluorescence units; SN, supernatant.
Fig 6
Fig 6. Endogenous vesicle-bound chemokines mediate the chemotactic find-me signal activity of ApoBDs.
ApoBDs isolated from mouse thymus induce migration of monocytes (A) and macrophages (B). (A) Chemotaxis of the human monocytic lines MM1 and THP1 in response to media alone (black bar) or ApoBD and cleared SN isolated from thymus homogenates of C57BL/6j mice 18 hours after i.p. inoculation with PBS (open bars) or DEX (solid bars). Cell migration was analyzed in 8-μm pore size transwell plates for 2 hours at 37°C. Bars represent mean ± SD migrated cells of triplicates from one experiment representative of 3 independent experiments. (B) Migration of BMDM in response to media alone (black bar) or ApoBD and SN isolated as in panel A from mice inoculated i.p. with PBS (open bars) or DEX (solid bars). Chemotaxis was assayed using 8-μm pore size polycarbonate membranes, and cells on the bottom side of the membrane were counted under the microscope after 1–2 hours at 37°C. Migration was analyzed in triplicates, and 6 random hpf (400× magnification) were counted in each well. Bars represent mean ± SD cells/hpf from one experiment representative of 3 independent experiments. (C) Phagocytes express multiple chemokine receptors. FACS histograms showing the staining of MM1 cells with R-PE-conjugated antibodies for the receptors (open histograms) indicated in the insets or the appropriate isotype controls (gray). (D) The monocytic chemotactic activity of ApoBD is mediated by chemokines. Migration of MM1 and THP1 cells toward media alone (black bars) or ApoBD from DEX-inoculated mice preincubated with buffer, the ATP hydrolase apyrase (2 U/ml), or the broad-spectrum chemokine inhibitors 35K and vCCL2 (200 nM). Chemotaxis was analyzed as in panel A. Bars represent the mean ± SD number of migrated cells measured in triplicate from one experiment and are representative of results from 3 independent experiments. (E) Vesicles are required for the phagocyte chemotactic activity of ApoBD. Migration of MM1 monocytes was analyzed as in panel A in response to SN or ApoBD fractions, which were either untreated or centrifuged (16,000 x g, 45 minutes) to remove vesicles, as indicated in the legend. Data are the % migration relative to the migration observed with untreated SN or ApoBD samples. Bars represent the mean ± SD % cell migration of triplicate determinations from 2 experiments combined after subtracting the corresponding background migration observed with media alone in each experiment. All indicated p-values are from a 2-way (panels A, B, and E) or 1-way (panel D) ANOVA test with Tukey correction for multiple comparisons. The underlying numerical values for the panels displaying summary numerical data can be found in S1 Data. ApoBD, apoptotic body; BMDM, bone marrow–derived macrophage; DEX, dexamethasone; FACS, fluorescence-activated cell sorting; hpf, high-power field; i.p., intraperitoneal; R-PE, R-Phycoerythrin; SN, supernatant.
Fig 7
Fig 7. Hypothetical model of chemokine-presenting apoptotic blebs guiding phagocytes toward apoptotic cells for their elimination.
Graphical representation of a proposed model for the role of vesicle-bound chemokines in apoptotic cell clearance. Chemokines produced by live or apoptotic lymphocytes interact with the surface of apoptotic blebs released from apoptotic cells via GAGs or membrane-exposed PS. GAGs mask the receptor-binding site of the chemokine, whereas PS-bound chemokines are able to simultaneously bind to and activate cognate chemokine receptors expressed by phagocytes. A gradient of chemokine-presenting apoptotic blebs guides phagocytes toward apoptotic cells. Phagocytes engulf and eliminate chemokine-presenting apoptotic blebs and apoptotic cells reducing inflammation. GAG, glycosaminoglycan; PS, phosphatidylserine.

Similar articles

Cited by

References

    1. Bachelerie F, Ben-Baruch A, Burkhardt AM, Combadiere C, Farber JM, et al.. International Union of Basic and Clinical Pharmacology. [corrected]. LXXXIX. Update on the extended family of chemokine receptors and introducing a new nomenclature for atypical chemokine receptors. Pharmacol Rev. 2014;66:1–79. doi: 10.1124/pr.113.007724 - DOI - PMC - PubMed
    1. Zlotnik A, Yoshie O. Chemokines: a new classification system and their role in immunity. Immunity. 2000;12:121–7. doi: 10.1016/s1074-7613(00)80165-x - DOI - PubMed
    1. Middleton J, Patterson AM, Gardner L, Schmutz C, Ashton BA. Leukocyte extravasation: chemokine transport and presentation by the endothelium. Blood. 2002;100:3853–60. doi: 10.1182/blood.V100.12.3853 - DOI - PubMed
    1. Monneau Y, Arenzana-Seisdedos F, Lortat-Jacob H. The sweet spot: how GAGs help chemokines guide migrating cells. J Leukoc Biol. 2016;99:935–53. doi: 10.1189/jlb.3MR0915-440R - DOI - PubMed
    1. Proudfoot AEI, Johnson Z, Bonvin P, Handel TM. Glycosaminoglycan Interactions with Chemokines Add Complexity to a Complex System. Pharmaceuticals (Basel). 2017;10. doi: 10.3390/ph10030070 - DOI - PMC - PubMed

Publication types

LinkOut - more resources