. 2021 Jun 7;56(11):1677-1693.e10.
doi: 10.1016/j.devcel.2021.05.001. Epub 2021 May 25.

A spatial vascular transcriptomic, proteomic, and phosphoproteomic atlas unveils an angiocrine Tie-Wnt signaling axis in the liver

Affiliations

A spatial vascular transcriptomic, proteomic, and phosphoproteomic atlas unveils an angiocrine Tie-Wnt signaling axis in the liver

Donato Inverso et al. Dev Cell. .

Abstract

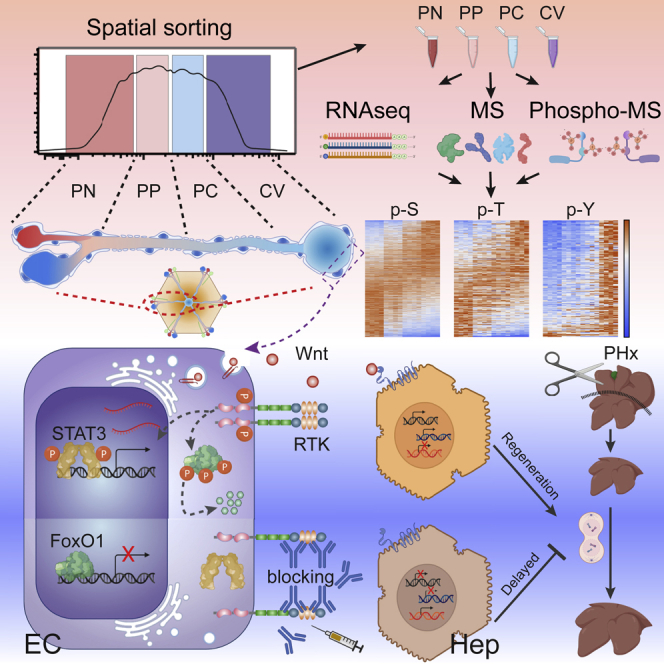
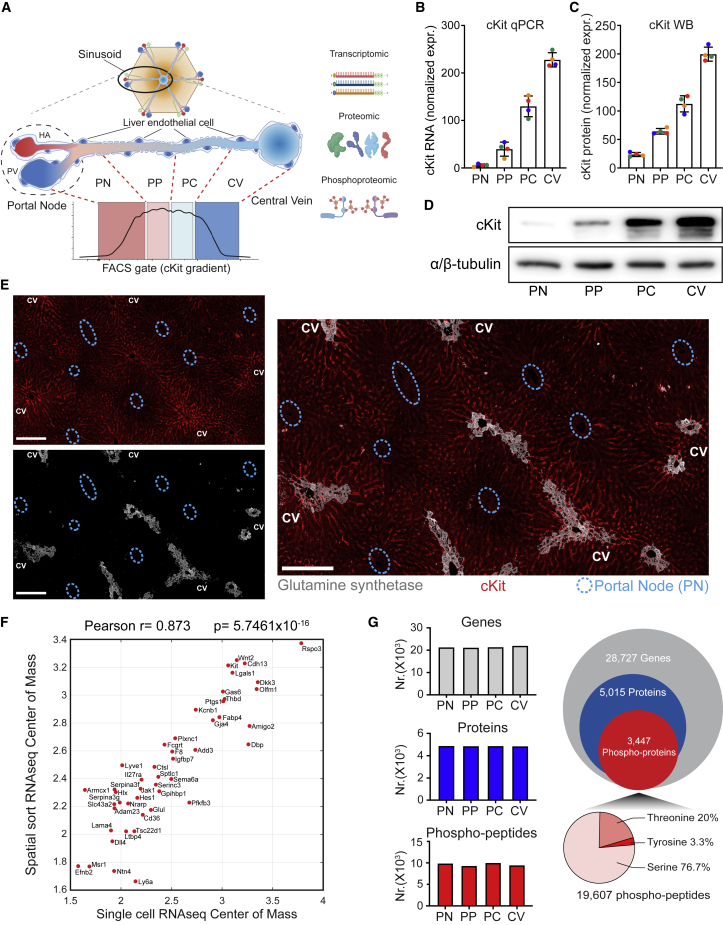
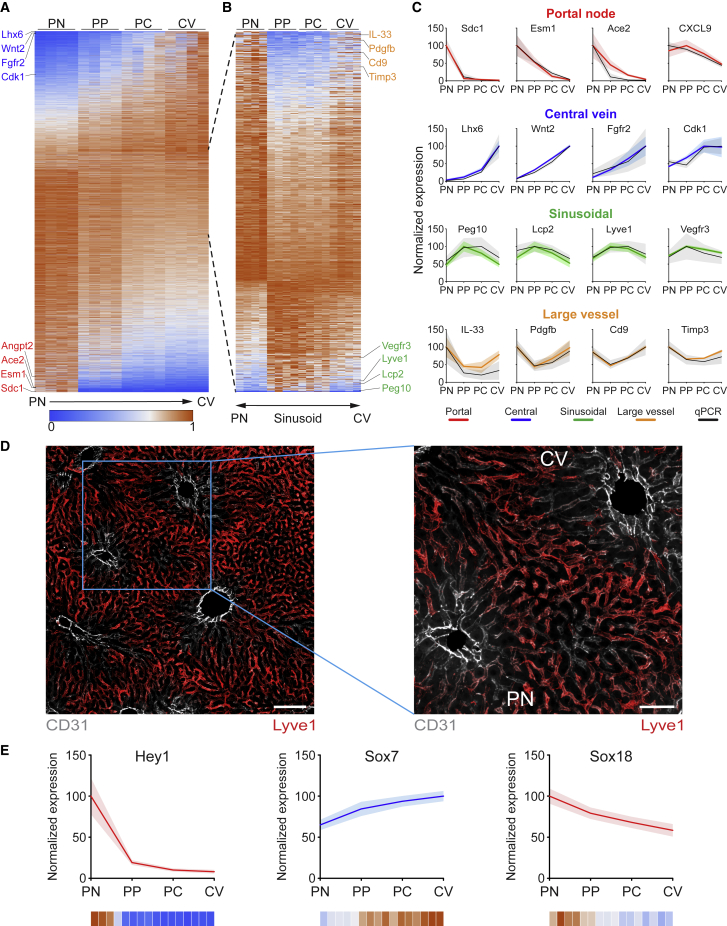
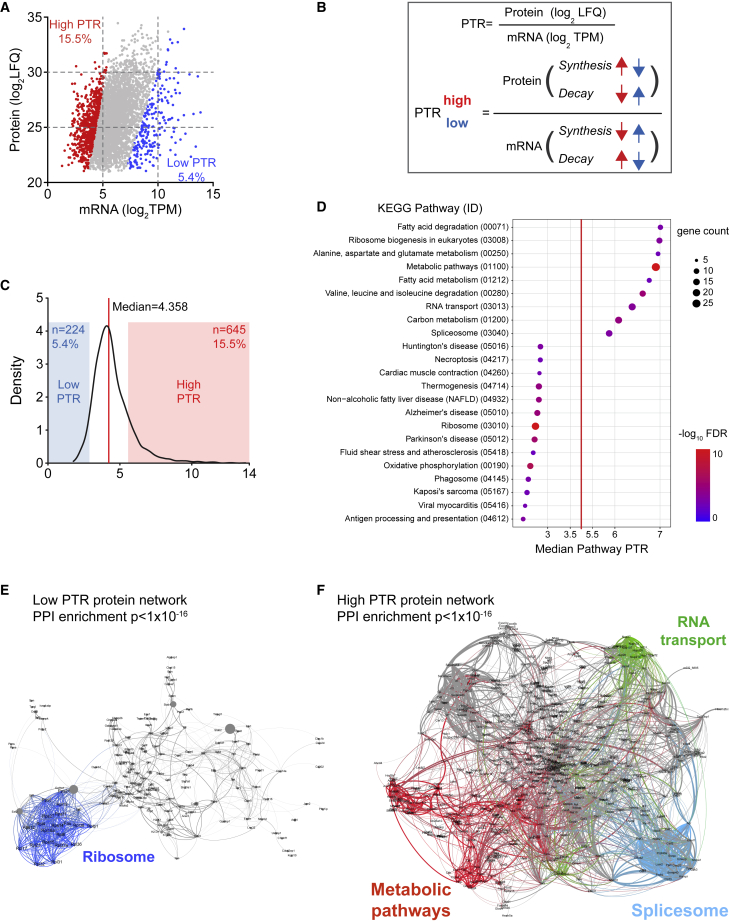
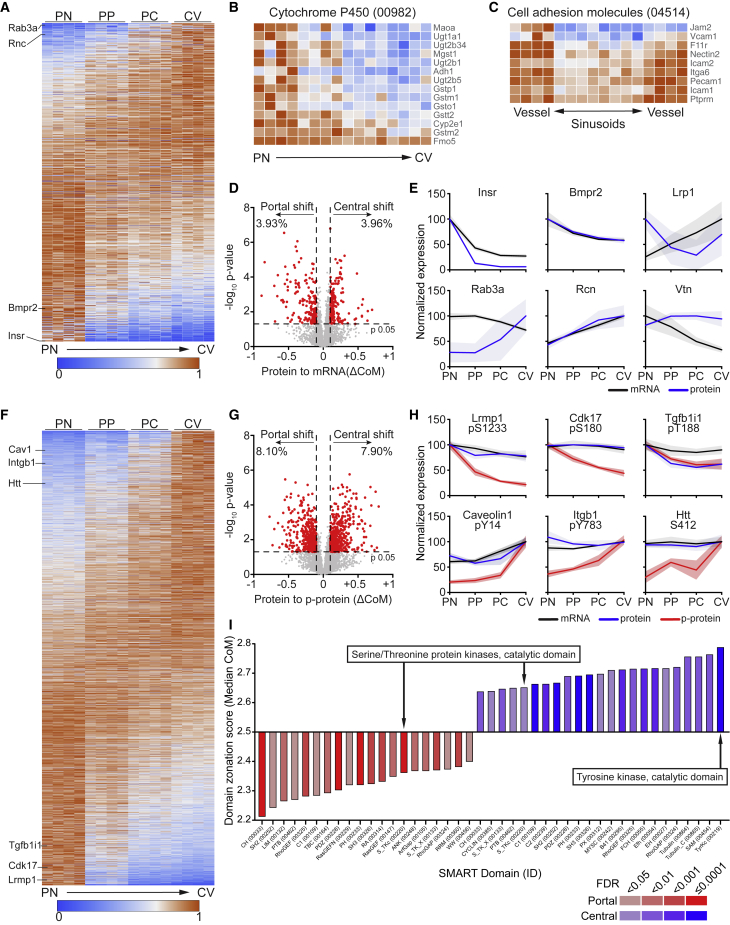
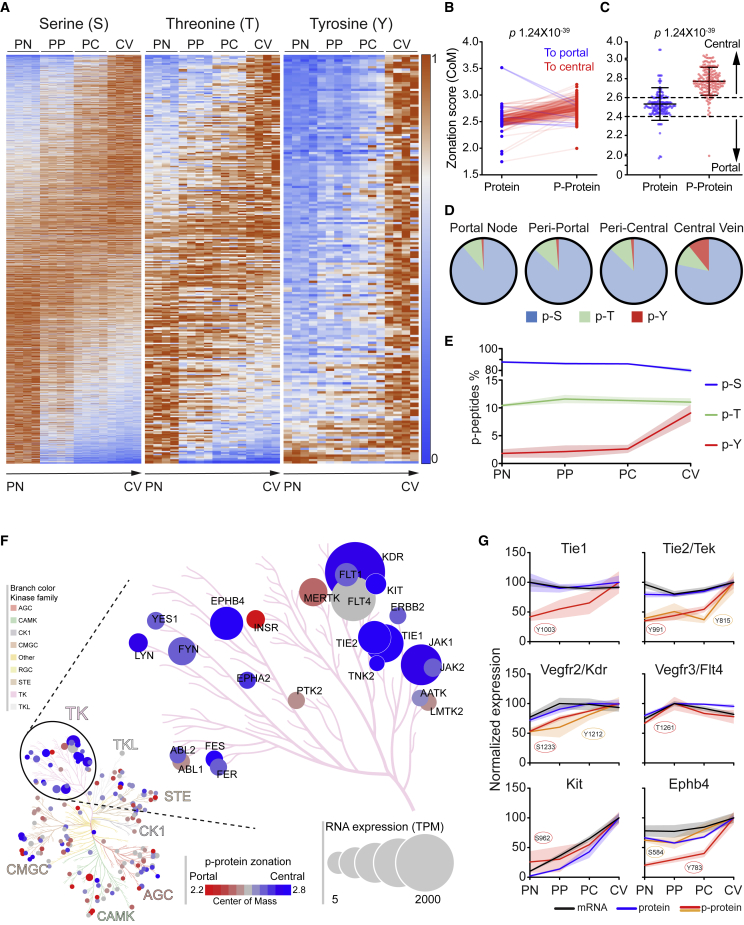
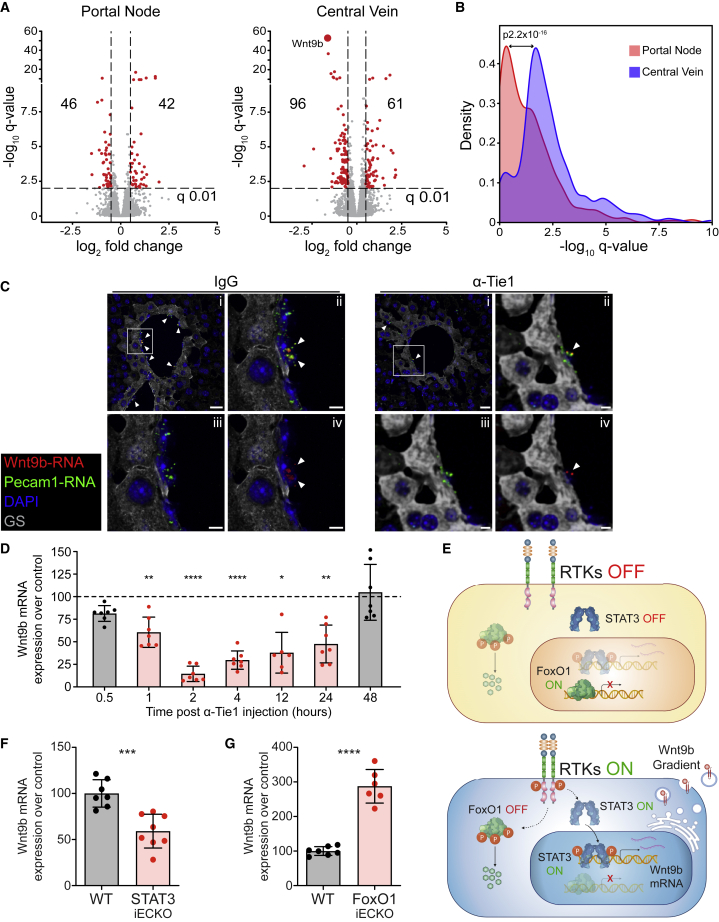
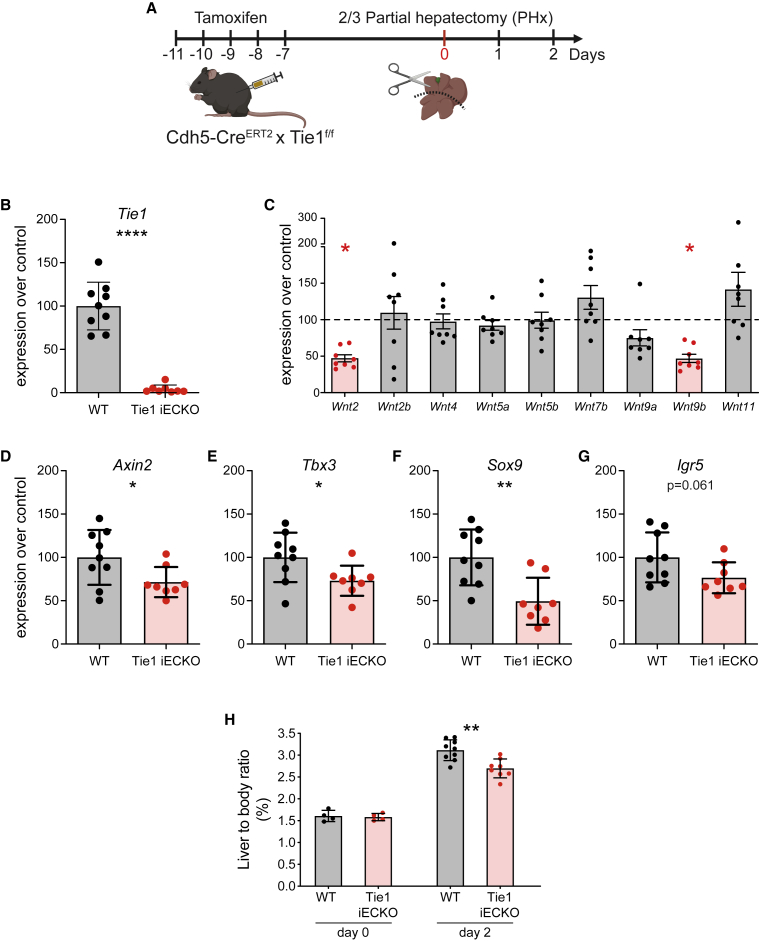
Single-cell transcriptomics (scRNA-seq) has revolutionized the understanding of the spatial architecture of tissue structure and function. Advancing the "transcript-centric" view of scRNA-seq analyses is presently restricted by the limited resolution of proteomics and genome-wide techniques to analyze post-translational modifications. Here, by combining spatial cell sorting with transcriptomics and quantitative proteomics/phosphoproteomics, we established the spatially resolved proteome landscape of the liver endothelium, yielding deep mechanistic insight into zonated vascular signaling mechanisms. Phosphorylation of receptor tyrosine kinases was detected preferentially in the central vein area, resulting in an atypical enrichment of tyrosine phosphorylation. Prototypic biological validation identified Tie receptor signaling as a selective and specific regulator of vascular Wnt activity orchestrating angiocrine signaling, thereby controlling hepatocyte function during liver regeneration. Taken together, the study has yielded fundamental insight into the spatial organization of liver endothelial cell signaling. Spatial sorting may be employed as a universally adaptable strategy for multiomic analyses of scRNA-seq-defined cellular (sub)-populations.

Keywords: Tie1; Tie2; Wnt; angiocrine factors; liver endothelial cell (L-EC); phosphoproteomics; proteomics; transcriptomics; vascular zonation.


Conflict of interest statement

Declaration of interests The authors declare no competing interests.

Figures

None
Graphical abstract
Figure 1
Figure 1
Spatial multiomics of the liver endothelium (A) Scheme of spatial sorting strategy. L-ECs from the portal node to CV were sorted into four consecutive subpopulations depending on their cKit staining gradient. PN, portal node; PP, peri-portal; PC, peri-central; CV, central vein. (B) Normalized expression of cKit mRNA from spatial sorted L-ECs determined by qPCR normalized to actin and further normalized to group mean. Each point represents an individual animal, dot colors indicate the samples from the same animal. Data are means ± SD. (C) Expression of cKit protein from the same mice indicated in (B) determined by western blot (WB), normalized to α/β-tubulin and further normalized to group mean. Data are means ± SD. (D) Representative WB images for (C). (E) Representative immunofluorescent staining of cKit (red) and glutamine synthetase (GS, gray) on liver section. Central vein areas are indicated by GS staining, and blue circles indicate portal areas. Left: single fluorescence channel of cKit and GS; right: overlay image. Scale bar, 200 μm. (F) Correlation of spatial sorting RNA-seq to scRNA-seq. RNA expression center-of-mass from single cell (x axis) and spatial sorting (y axis) RNA-seq of 48 genes significantly zonated in both datasets. (G) Total number of detected genes (gray), proteins (blue), and phospho-sites (red). The left graphs show detected genes, proteins, and phospho-sites in each indicated sorting gate (n = 4). The circles on the right depict cumulative data from all gates. See also Figure S1.
Figure 2
Figure 2
Transcriptome zonation defines distinct L-EC signatures (A) Heatmap representation of the expression profiles of 4,943 genes with significantly zonated expression. Genes are normalized to their maximum expression and sorted by their center-of-mass. Representative central and portal zonated genes are indicated in blue and red, respectively (n = 4). (B) Expression profiles of 890 genes significantly zonated on large vessels or sinusoids. Genes are normalized to their maximum expression and sorted by their log2 fold change of vessel to sinusoid. Representative vessel and sinusoidal zonated genes are indicated in orange and green, respectively (n = 4). (C) Representative gene expression profiles for each zonation pattern (as indicated by color) with the corresponding qRT-PCR validation (black). Gene expression is represented by percentage of maximum; patches represent SD (n = 4). (D) Representative liver immunofluorescence staining for large vessel and sinusoidal zonation patterns. CD31 in gray represents large vessel zonation and Lyve-1 in red represents sinusoidal zonation. Scale bars, 100 μm (left), 50 μm (right). (E) Expression profiles of representative transcription factors zonated in the L-ECs. Gene expression is represented by percentage of maximum; patches represent SD (n = 4); color scale indicates relative expression of individual samples as in (A). See also Figures S2 and S3.
Figure 3
Figure 3
Post-transcriptional regulation of the protein abundance (A) Scatterplot of protein and RNA abundance (mean expression across all zones). Red and blue mark the genes with a high and low PTR as defined in (B and C). (B) Protein-to-transcript ratio (PTR) definition. Regulation on synthesis/decay, which contributes toward high or low PTR are indicated with arrows marked with blue and red, respectively. (C) Distribution of PTR values of protein-RNA pairs. The red line indicates the median and the red and blue overlay display ±1 SD from the median, defined as high or low PTR range. (D) Dot plot of the KEGG pathways significantly enriched in the gene sets corresponding to low or high PTR. Pathways (y axis) are ordered from low to high PTR by increasing median PTR value (x axis) of the proteins enriched in the pathway. Dot size and color indicate gene count and −log10 FDR for each pathway, respectively. (E and F) Interaction network of low (E) and high (F) PTR proteins. Interaction was based on STRING and visualized by Gephi. Node size is proportional to the protein abundance (LFQ) and the edge weight is proportional to the combined interaction score. Proteins (node) and the related interaction (edge) belonging to selected pathways were highlighted as indicated in the figures.
Figure 4
Figure 4
Spatial proteomics reveals a differential phosphorylation along the liver vasculature (A–C) Heatmap representation of the expression profiles of 1,042 proteins with significantly zonated expression (A), “cytochrome P450” (KEGG pathway mmu00982) (B) and “cell adhesion molecules” (KEGG pathway mmu04514) (C). Proteins are normalized to their maximum expression and sorted by their center-of-mass (A and B) or their vessel to sinusoid log2 fold change (C) (n = 4). (D) Zonation shift of the protein-RNA pairs. ΔCoM is the difference between the overall protein CoM and RNA CoM, indicative for the zonation shift. Unpaired Student’s t test was used to determine the difference between the protein CoM values from the four biological replicates and the four RNA CoM values. Red dots in the scatter dot plot mark significantly shifted genes, and their percentages were indicated above. (E) Expression profiles of the indicated proteins-RNA pairs. Expression is represented by percentage of maximum; patches represent SD (n = 4). (F) Heatmap representation (as described in A) of the expression profiles of 2,828 p-peptides with significantly zonated expression (n = 4). (G) Scatter dot plot of the ΔCoM and the log10 p value of 7,520 p-peptide-protein pairs, showing zonation shift of p-peptide to protein. Red dots mark significantly shifted proteins. (H) Expression profiles of the indicated matches of p-peptides (red), proteins (blue), and RNA (black). Expression is represented by percentage of maximum; patches represent SD (n = 4). (I) Bar graph of the SMART protein domains significantly enriched for portal (red) or for central (blue) zonated phosphorylated proteins. Domains (x axis) are ordered from portal to central by increasing median center-of-mass (y axis) of the proteins enriched for the domain. Bar color indicates the FDR range for the enrichment score. See also Figure S4.
Figure 5
Figure 5
Peri-central compartmentalization of tyrosine phosphorylation (A) Heatmap representations of significantly zonated phospho-serine (P-S), phospho-threonine (P-T), and phospho-tyrosine (P-Y). P-peptides are normalized to their maximum expression and sorted by their center-of-mass (n = 4). (B and C) Variation of the zonation score of p-Y peptides and corresponding proteins. (B) Aligned dot plot of the CoM relative to p-Y peptides and corresponding proteins. Before-after connecting lines indicate a shift to central (red) or to portal (blue). (C) Scatter dot plot of the same groups represented in (B). Data are represented as mean ± SD. (D and E) Distribution of all class-I p-S, p-T, and p-Y for their strongest expressing zone. Each p-site was assigned to one zone according to the maximum expression, by average expression of four biological replicates (D) or for each replicate (E). Afterward, distribution was calculated for each zone and shown as pie charts (D) or connecting lines (E) with patches indicating SD of the four replicates. (F) Kinome phylogenetic tree of phosphorylated kinases. Each kinase is represented by a circle and grouped by kinases family. The circle size is proportional to the corresponding TPM. The color represents phosphorylation zonation from portal (red) to central (blue). (G) Expression profiles of matches of p-peptides (red or orange), proteins (blue), and RNA (black) for the indicated receptor tyrosine kinases. Expression is represented by percentage of maximum; patches represent SD (n = 4). See also Figures S5 and S6.
Figure 6
Figure 6
CV phosphorylation of the tyrosine kinase Tie1 shapes L-EC zonation and maintains Wnt9b gradient (A) Differential gene expression induced by Tie1 blockade. Volcano plots of gene regulations 2 h after Tie1 blockade in spatially sorted L-ECs from portal node (left) and central vein (right), respectively. Red dots mark the significantly regulated genes, indicated by the number in each square. (B) Histogram of the −log10 q value distribution of regulated genes in portal node and/or central vein 2 h after Tie1 blockade. The effect of Tie1 blockade on PN and CV was compared by Wilcoxon matched-pairs signed rank test of the −log10 q values. (C) RNA fluorescence in situ hybridization (FISH) analysis of Wnt9b RNA (red) 2 h after treatment of anti-Tie1 antibody, compared with IgG control. Endothelial cells were visualized by Pecam1 RNA (green) FISH staining, CV areas by glutamine synthetase (GS, gray) immunostaining, and cell nuclei (blue) counterstained with DAPI. (i) Overlay image of central vein area; (ii–iv) Zoomed overlay image (ii), Pecam1 RNA (iii), and Wnt9b RNA (iv) of the area indicated in (i). Arrow heads indicate Wnt9b RNA staining. Scale bars, 20 μm (i) and 5 μm (ii–iv). (D) RNA expression of Wnt9b in the whole liver tissues from anti-Tie1 Ab-treated mice at the indicated time points, normalized to the relative IgG-treated mice (dashed line), significantly regulated time points highlighted in red. (E) Signaling scheme of FoxO1 and STAT3 activation and nuclear translocation with inactive (top) or active (bottom) RTK signaling. (F and G) RNA expression of Wnt9b in Stat3iECKO (F) and Foxo1iECKO (G) mice (red bar) normalized to the relative control mice (Cre- littermates, gray bar) from isolated L-ECs. (C, F and G) RNA expression was determined by qRT-PCR and normalized to Actb. Data are expressed as percentage normalized to the corresponding controls. Each data point represents one animal. Data are means ± SD. Unpaired Student’s t test was used to determine the difference between experimental groups. p < 0.05; ∗∗p < 0.01; ∗∗∗p < 0.001; ∗∗∗∗p < 0.0001. See also Figure S7.
Figure 7
Figure 7
Tie1-induced Wnt is required for liver regeneration (A) Experimental schedule for inducible EC-specific knockout of Tie1 (Tie1iECKO) followed by two-thirds partial hepatectomy (PHx). (B) mRNA expression of Tie1 from whole liver tissues 2 days after two-thirds PHx in Tie1iECKO mice and corresponding controls (Cre- littermates, gray bar). (C) mRNA expression of Wnt ligands from whole liver tissues 2 days after two-thirds PHx in Tie1iECKO mice and the relative control mice (Cre- littermates, dashed line). Significantly regulated genes were highlighted in red. (D–G) mRNA expression of Wnt target genes, Axin2 (D), Tbx3 (E), Sox9 (F), and Lgr5 (G) from whole liver tissue 2 days after two-thirds PHx in Tie1iECKO mice (red bar) and corresponding controls (Cre- littermates, gray bar). (H) Liver-to-body ratio of Tie1iECKO (red bar) and relative controls (Cre- littermates, gray bar) at the indicated time points after two-thirds PHx. (B–G) mRNA expression was determined by qRT-PCR and normalized to Actb. Data are expressed as percentage normalized to the corresponding controls. Each data point represents one animal. Data are means ± SD. Unpaired Student’s t test was used to determine the difference between experimental groups. p < 0.05; ∗∗p < 0.01; ∗∗∗p < 0.001; ∗∗∗∗p < 0.0001. See also Figure S7.

References

    1. Afgan E., Baker D., Batut B., van den Beek M., Bouvier D., Cech M., Chilton J., Clements D., Coraor N., Grüning B.A. The Galaxy platform for accessible, reproducible and collaborative biomedical analyses: 2018 update. Nucleic Acids Res. 2018;46:W537–W544. - PMC - PubMed
    1. Bastian, M., Heymann, S., and Jacomy, M. (2009). Gephi: an open source software for exploring and manipulating networks. Third international AAAI conference on weblogs and social media 8, pp. 361–362.
    1. Ben-Moshe S., Shapira Y., Moor A.E., Manco R., Veg T., Bahar Halpern K., Itzkovitz S. Spatial sorting enables comprehensive characterization of liver zonation. Nat. Metab. 2019;1:899–911. - PMC - PubMed
    1. Blighe, K., Rana, S., and Lewis, M. (2020). EnhancedVolcano: publication-ready volcano plots with enhanced colouring and labeling. R package version 1.8.0, 10.18129/B9.bioc.EnhancedVolcano.
    1. Cao Z., Ye T., Sun Y., Ji G., Shido K., Chen Y., Luo L., Na F., Li X., Huang Z. Targeting the vascular and perivascular niches as a regenerative therapy for lung and liver fibrosis. Sci. Transl. Med. 2017;9 - PMC - PubMed

Publication types

Substances