

Multi-channel attention-fusion neural network for brain age estimation: Accuracy, generality, and interpretation with 16,705 healthy MRIs across lifespan
- PMID: 34038818
- PMCID: PMC8316301
- DOI: 10.1016/j.media.2021.102091
Multi-channel attention-fusion neural network for brain age estimation: Accuracy, generality, and interpretation with 16,705 healthy MRIs across lifespan
Abstract
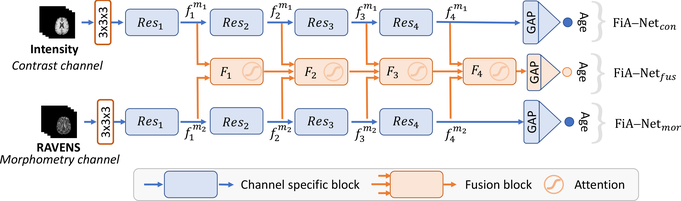
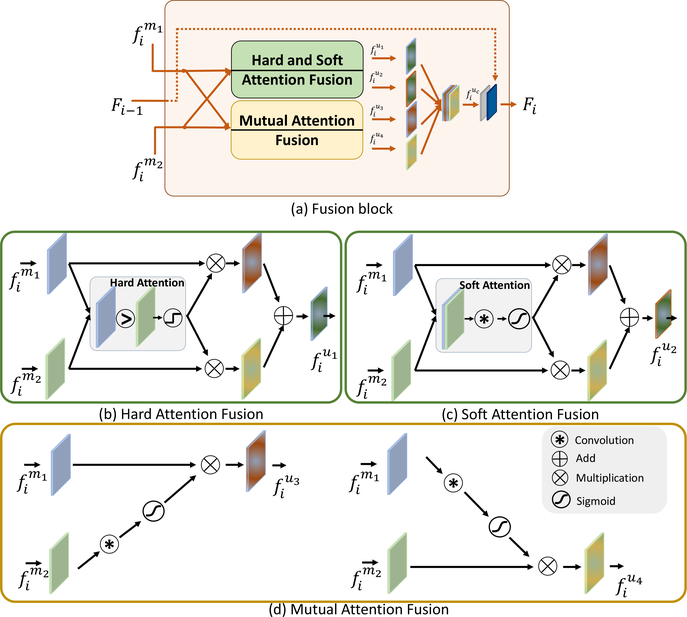
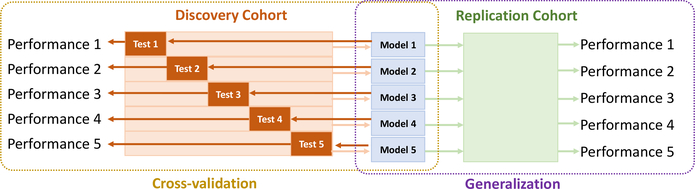
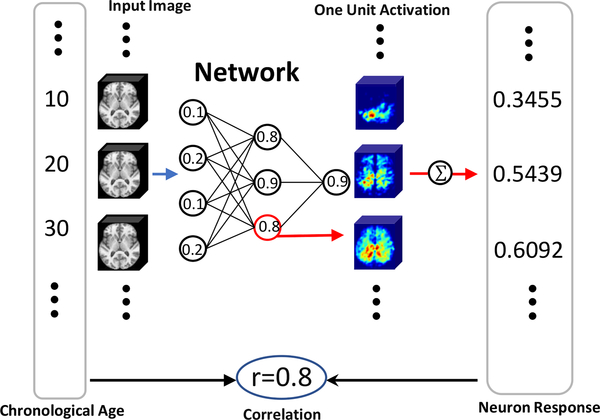
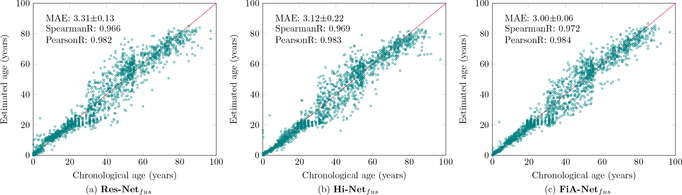
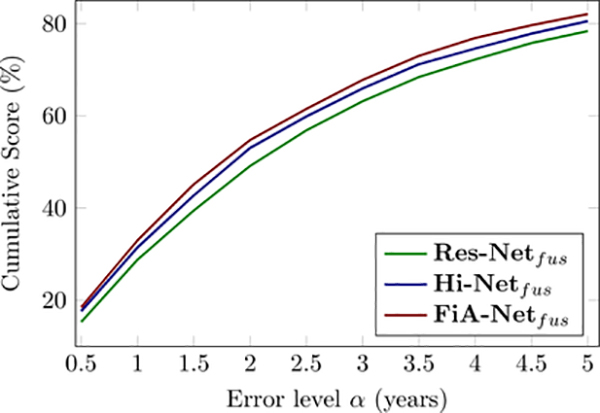
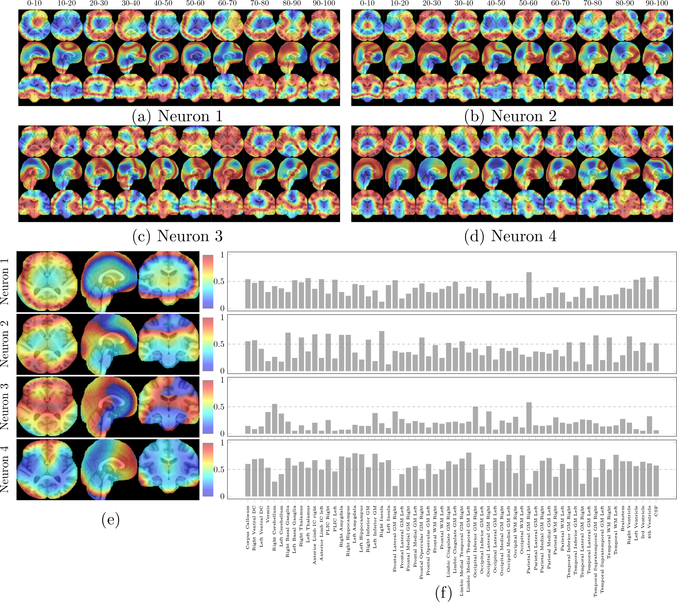
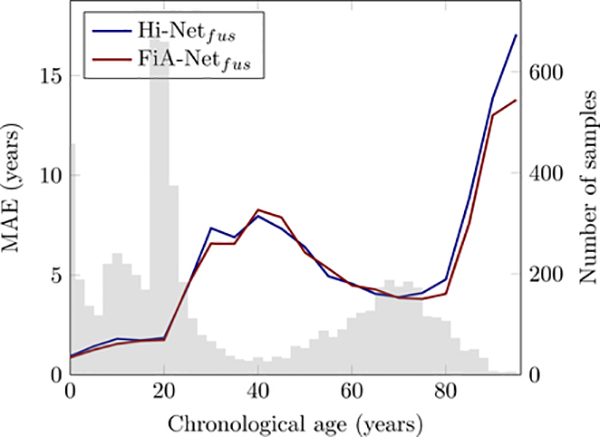
Brain age estimated by machine learning from T1-weighted magnetic resonance images (T1w MRIs) can reveal how brain disorders alter brain aging and can help in the early detection of such disorders. A fundamental step is to build an accurate age estimator from healthy brain MRIs. We focus on this step, and propose a framework to improve the accuracy, generality, and interpretation of age estimation in healthy brain MRIs. For accuracy, we used one of the largest sample sizes (N = 16,705). For each subject, our proposed algorithm first explicitly splits the T1w image, which has been commonly treated as a single-channel 3D image in other studies, into two 3D image channels representing contrast and morphometry information. We further proposed a "fusion-with-attention" deep learning convolutional neural network (FiA-Net) to learn how to best fuse the contrast and morphometry image channels. FiA-Net recognizes varying contributions across image channels at different brain anatomy and different feature layers. In contrast, multi-channel fusion does not exist for brain age estimation, and is mostly attention-free in other medical image analysis tasks (e.g., image synthesis, or segmentation), where treating channels equally may not be optimal. For generality, we used lifespan data 0-97 years of age for real-world utility; and we thoroughly tested FiA-Net for multi-site and multi-scanner generality by two phases of cross-validations in discovery and replication data, compared to most other studies with only one phase of cross-validation. For interpretation, we directly measured each artificial neuron's correlation with the chronological age, compared to other studies looking at the saliency of features where salient features may or may not predict age. Overall, FiA-Net achieved a mean absolute error (MAE) of 3.00 years and Pearson correlation r=0.9840 with known chronological ages in healthy brain MRIs 0-97 years of age, comparing favorably with state-of-the-art algorithms and studies for accuracy and generality across sites and datasets. We also provided interpretations on how different artificial neurons and real neuroanatomy contribute to the age estimation.
Keywords: Age prediction; Attention network; Deep learning; Lifespan brain MRI; Multi-channel fusion.
Copyright © 2021 Elsevier B.V. All rights reserved.
Conflict of interest statement
Declaration of Competing Interest The authors declare that they have no known competing financial interests or personal relationships that could have appeared to influence the work reported in this paper.
Figures
Similar articles
-
Postoperative glioma segmentation in CT image using deep feature fusion model guided by multi-sequence MRIs.Eur Radiol. 2020 Feb;30(2):823-832. doi: 10.1007/s00330-019-06441-z. Epub 2019 Oct 24. Eur Radiol. 2020. PMID: 31650265
-
MABAL: a Novel Deep-Learning Architecture for Machine-Assisted Bone Age Labeling.J Digit Imaging. 2018 Aug;31(4):513-519. doi: 10.1007/s10278-018-0053-3. J Digit Imaging. 2018. PMID: 29404850 Free PMC article.
-
Predicting brain age with deep learning from raw imaging data results in a reliable and heritable biomarker.Neuroimage. 2017 Dec;163:115-124. doi: 10.1016/j.neuroimage.2017.07.059. Epub 2017 Jul 29. Neuroimage. 2017. PMID: 28765056
-
PMJAF-Net: Pyramidal multi-scale joint attention and adaptive fusion network for explainable skin lesion segmentation.Comput Biol Med. 2023 Oct;165:107454. doi: 10.1016/j.compbiomed.2023.107454. Epub 2023 Sep 12. Comput Biol Med. 2023. PMID: 37716246 Review.
-
Role of deep learning in infant brain MRI analysis.Magn Reson Imaging. 2019 Dec;64:171-189. doi: 10.1016/j.mri.2019.06.009. Epub 2019 Jun 20. Magn Reson Imaging. 2019. PMID: 31229667 Free PMC article. Review.
Cited by
-
Assessing Machine Learning Models for Predicting Age with Intracranial Vessel Tortuosity and Thickness Information.Brain Sci. 2023 Oct 26;13(11):1512. doi: 10.3390/brainsci13111512. Brain Sci. 2023. PMID: 38002472 Free PMC article.
-
Exploring the relationship among Alzheimer's disease, aging and cognitive scores through neuroimaging-based approach.Sci Rep. 2024 Nov 10;14(1):27472. doi: 10.1038/s41598-024-78712-9. Sci Rep. 2024. PMID: 39523370 Free PMC article.
-
Inferring neurocognition using artificial intelligence on brain MRIs.Front Neuroimaging. 2024 Nov 27;3:1455436. doi: 10.3389/fnimg.2024.1455436. eCollection 2024. Front Neuroimaging. 2024. PMID: 39664769 Free PMC article. Review.
-
[18F]FDG PET integrated with structural MRI for accurate brain age prediction.Eur J Nucl Med Mol Imaging. 2024 Oct;51(12):3617-3629. doi: 10.1007/s00259-024-06784-w. Epub 2024 Jun 6. Eur J Nucl Med Mol Imaging. 2024. PMID: 38839623
-
The role of cortical structural variance in deep learning-based prediction of fetal brain age.Front Neurosci. 2024 May 23;18:1411334. doi: 10.3389/fnins.2024.1411334. eCollection 2024. Front Neurosci. 2024. PMID: 38846713 Free PMC article.
References
-
- Becker BG, Klein T, Wachinger C, Initiative ADN, et al., 2018. Gaussian process uncertainty in age estimation as a measure of brain abnormality. NeuroImage 175, 246–258. - PubMed
Publication types
MeSH terms
Grants and funding
LinkOut - more resources
Full Text Sources
Other Literature Sources
