

Genome-wide identification and functional analysis of U-box E3 ubiquitin ligases gene family related to drought stress response in Chinese white pear (Pyrus bretschneideri)
- PMID: 34039263
- PMCID: PMC8152096
- DOI: 10.1186/s12870-021-03024-3
Genome-wide identification and functional analysis of U-box E3 ubiquitin ligases gene family related to drought stress response in Chinese white pear (Pyrus bretschneideri)
Abstract
Background: The plant U-box (PUB) proteins are a family of ubiquitin ligases (E3) enzymes that involved in diverse biological processes, as well as in responses to plant stress response. However, the characteristics and functional divergence of the PUB gene family have not yet been previously studied in the Chinese white pear (Pyrus bretschneideri).
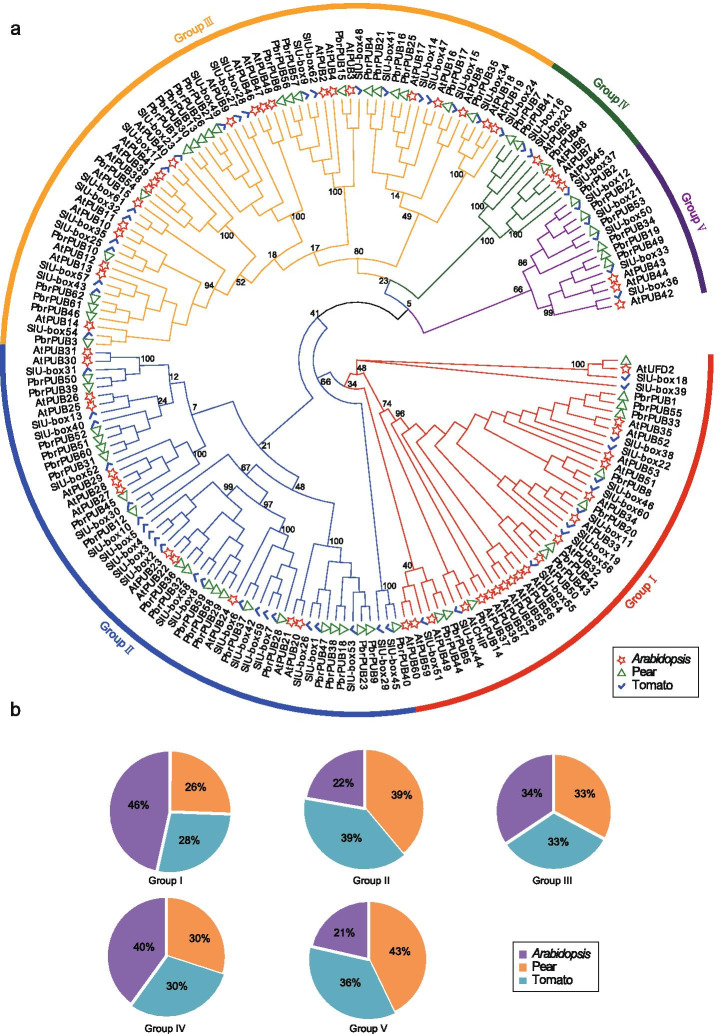
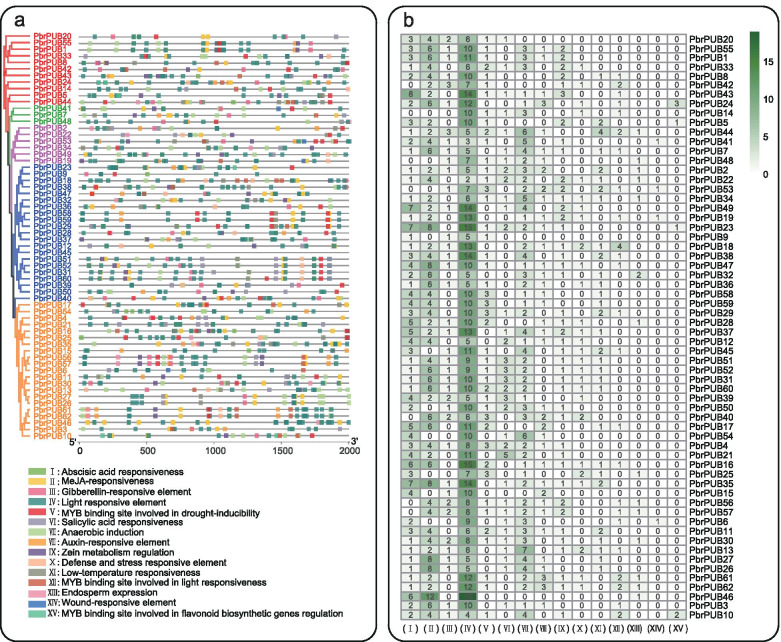
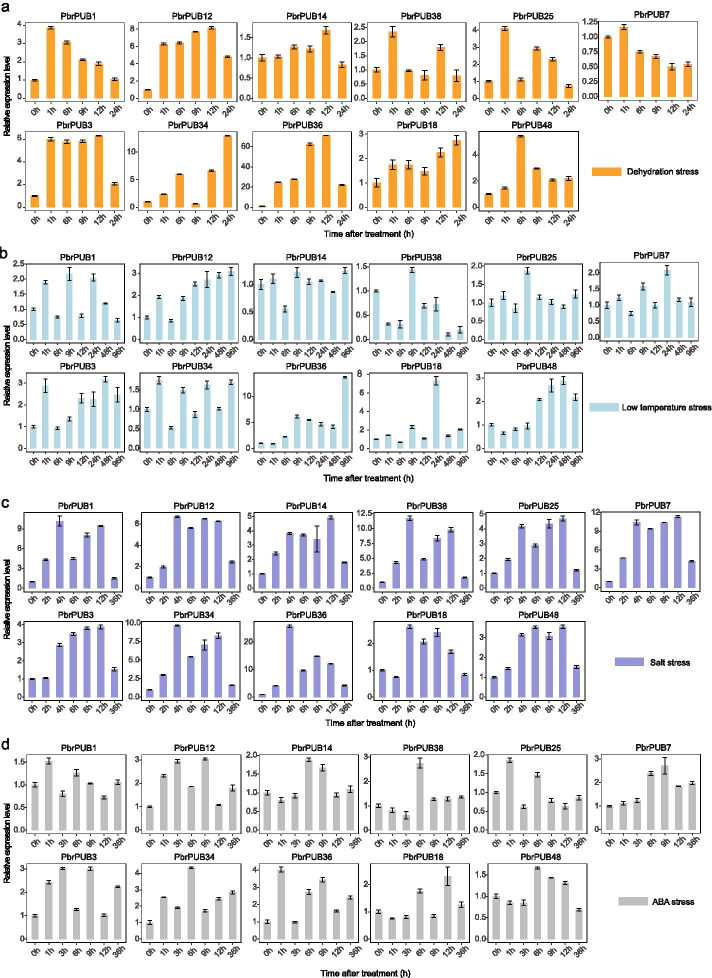
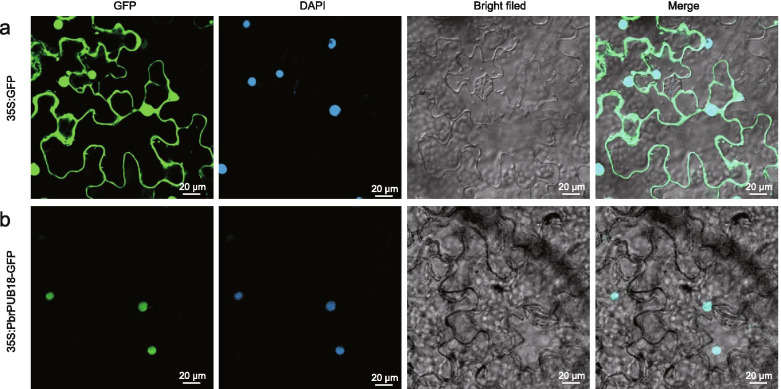
Results: In the present study, we identified 62 PbrPUBs in Chinese white pear genome. Based on the phylogenetic relationship, 62 PUB genes were clustered into five groups. The results of conserved motif and gene structure analysis supported the classification phylogenetic tree. The PbrPUB genes were unevenly distribution on 17 pear chromosomes, chromosome 15 housed most member of PUB family, with eight PUB genes. Cis-acting element analysis indicated that PUB genes might participate in diverse biological processes, especially in the response to abiotic stresses. Based on RNA-data from 'Dangshansuli' at seven tissues, we found that PUB genes exhibited diverse of expression level in seven tissues, and qRT-PCR experiment further supported the reliable of RNA-Seq data. To identify candidate genes associated with resistance, we conducted qRT-PCR experiment the expression level of pear seed plant under four abiotic stresses, including: ABA, dehydration, salt and cold treatment. One candidate PUB gene associated with dehydration stress was selected to conduct further functional experiment. Subcellular localization revealed PbrPUB18 protein was located on cell nucleus. Furthermore, heterologous over-expression of PbrPUB18 in Arabidopsis indicated that the over-expression of PbrPUB18 could enhance resistance in drought treatment. In conclusions, we systematically identified the PUB genes in pear, and provided useful knowledge for functional identification of PUB genes in pear.
Keywords: Abiotic stresses; PUB gene family; PbrPUB18; Pyrus; Ubiquitin ligases.
Conflict of interest statement
The authors declare that they have no competing interests.
Figures


Similar articles
-
Genome-wide identification of the Phospholipase D (PLD) gene family in Chinese white pear (Pyrus bretschneideri) and the role of PbrPLD2 in drought resistance.Plant Sci. 2025 Jan;350:112286. doi: 10.1016/j.plantsci.2024.112286. Epub 2024 Oct 11. Plant Sci. 2025. PMID: 39396619
-
Genome-wide analyses and expression patterns under abiotic stress of NAC transcription factors in white pear (Pyrus bretschneideri).BMC Plant Biol. 2019 Apr 25;19(1):161. doi: 10.1186/s12870-019-1760-8. BMC Plant Biol. 2019. PMID: 31023218 Free PMC article.
-
Genome-wide identification and characterization of bZIP transcription factors and their expression profile under abiotic stresses in Chinese pear (Pyrus bretschneideri).BMC Plant Biol. 2021 Sep 9;21(1):413. doi: 10.1186/s12870-021-03191-3. BMC Plant Biol. 2021. PMID: 34503442 Free PMC article.
-
News from the PUB: plant U-box type E3 ubiquitin ligases.J Exp Bot. 2018 Jan 23;69(3):371-384. doi: 10.1093/jxb/erx411. J Exp Bot. 2018. PMID: 29237060 Review.
-
The diversity of plant U-box E3 ubiquitin ligases: from upstream activators to downstream target substrates.J Exp Bot. 2009;60(4):1109-21. doi: 10.1093/jxb/ern369. Epub 2009 Feb 5. J Exp Bot. 2009. PMID: 19196749 Review.
Cited by
-
Mining of the CULLIN E3 ubiquitin ligase genes in the whole genome of Salvia miltiorrhiza.Curr Res Food Sci. 2022 Oct 8;5:1760-1768. doi: 10.1016/j.crfs.2022.10.011. eCollection 2022. Curr Res Food Sci. 2022. PMID: 36268136 Free PMC article.
-
Genome-wide identification and transcriptome profiling expression analysis of the U-box E3 ubiquitin ligase gene family related to abiotic stress in maize (Zea mays L.).BMC Genomics. 2024 Feb 1;25(1):132. doi: 10.1186/s12864-024-10040-8. BMC Genomics. 2024. PMID: 38302871 Free PMC article.
-
Genome-wide characterization of ubiquitin-conjugating enzyme gene family explores its genetic effects on the oil content and yield of Brassica napus.Front Plant Sci. 2023 Mar 20;14:1118339. doi: 10.3389/fpls.2023.1118339. eCollection 2023. Front Plant Sci. 2023. PMID: 37021309 Free PMC article.
-
Genome-wide identification and expression analysis of the U-box gene family related to biotic and abiotic stresses in Coffea canephora L.BMC Genomics. 2024 Oct 1;25(1):916. doi: 10.1186/s12864-024-10745-w. BMC Genomics. 2024. PMID: 39354340 Free PMC article.
-
Genome-wide identification and expression analysis of the U-box E3 ubiquitin ligase gene family related to bacterial wilt resistance in tobacco (Nicotiana tabacum L.) and eggplant (Solanum melongena L.).Front Plant Sci. 2024 Jul 30;15:1425651. doi: 10.3389/fpls.2024.1425651. eCollection 2024. Front Plant Sci. 2024. PMID: 39139726 Free PMC article.
References
-
- Zhang ZY, Li JH, Liu HH, Chong K, Xu YY. Roles of ubiquitination- mediated protein degradation in plant responses to abiotic stresses. Environ Exp Bot. 2015;114:92–103. doi: 10.1016/j.envexpbot.2014.07.005. - DOI
MeSH terms
Substances
Grants and funding
LinkOut - more resources
Full Text Sources
Other Literature Sources
