

Transmission dynamics and control of two epidemic waves of SARS-CoV-2 in South Korea
- PMID: 34039296
- PMCID: PMC8154110
- DOI: 10.1186/s12879-021-06204-6
Transmission dynamics and control of two epidemic waves of SARS-CoV-2 in South Korea
Erratum in
-
Correction to: Transmission dynamics and control of two epidemic waves of SARS-CoV-2 in South Korea.BMC Infect Dis. 2021 Jul 7;21(1):660. doi: 10.1186/s12879-021-06358-3. BMC Infect Dis. 2021. PMID: 34233629 Free PMC article. No abstract available.
Abstract
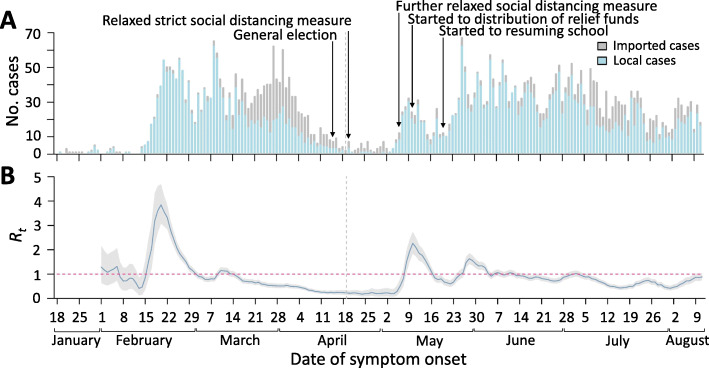
Background: After relaxing social distancing measures, South Korea experienced a resurgent second epidemic wave of coronavirus disease 2019 (COVID-19). In this study, we aimed to identify the transmission dynamics of severe acute respiratory syndrome coronavirus 2 (SARS-CoV-2) infections and assess the impact of COVID-19 case finding and contact tracing in each epidemic wave.
Methods: We collected data on COVID-19 cases published by local public health authorities in South Korea and divided the study into two epidemic periods (19 January-19 April 2020 for the first epidemic wave and 20 April-11 August 2020 for the second epidemic wave). To identify changes in the transmissibility of SARS-CoV-2, the daily effective reproductive number (Rt) was estimated using the illness onset of the cases. Furthermore, to identify the characteristics of each epidemic wave, frequencies of cluster types were measured, and age-specific transmission probability matrices and serial intervals were estimated. The proportion of asymptomatic cases and cases with unknown sources of infection were also estimated to assess the changes of infections identified as cases in each wave.
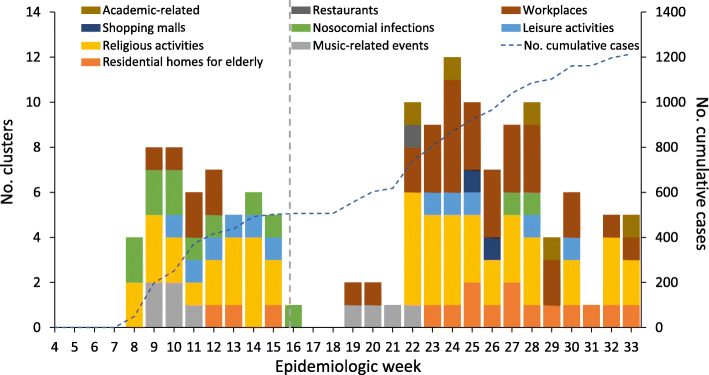
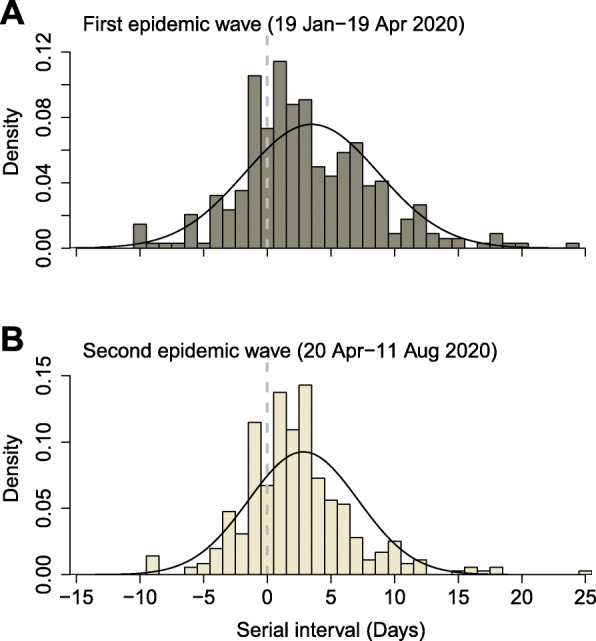
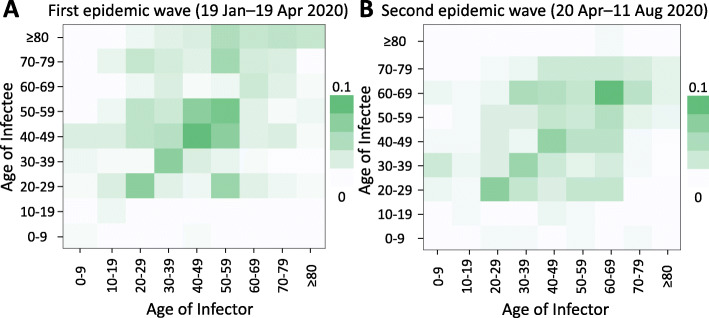
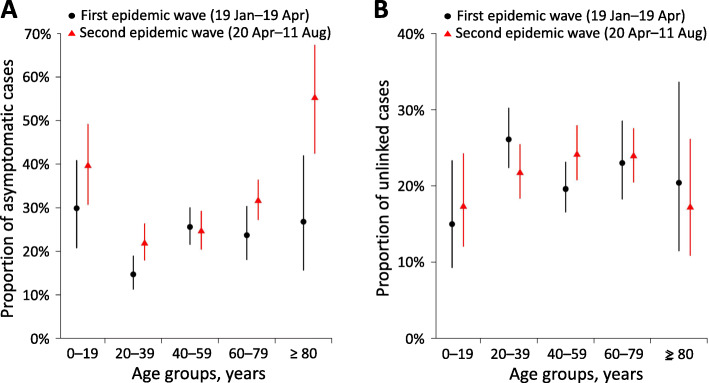
Results: In early May 2020, within 2-weeks of a relaxation in strict social distancing measures, Rt increased rapidly from 0.2 to 1.8 within a week and was around 1 until early July 2020. In both epidemic waves, the most frequent cluster types were religious-related activities and transmissions among the same age were more common. Furthermore, children were rarely infectors or infectees, and the mean serial intervals were similar (~ 3 days) in both waves. The proportion of asymptomatic cases at presentation increased from 22% (in the first wave) to 27% (in the second wave), while the cases with unknown sources of infection were similar in both waves (22 and 24%, respectively).
Conclusions: Our study shows that relaxing social distancing measures was associated with increased SARS-CoV-2 transmission despite rigorous case findings in South Korea. Along with social distancing measures, the enhanced contact tracing including asymptomatic cases could be an efficient approach to control further epidemic waves.
Keywords: COVID-19; Epidemiology; SARS-CoV-2; Social distancing measure; Transmission.
Conflict of interest statement
BJC reports honoraria from Sanofi Pasteur and Roche. All other authors declare no competing interests.
Figures
References
-
- Li Q, Guan X, Wu P, Wang X, Zhou L, Tong Y, Ren R, Leung KSM, Lau EHY, Wong JY, Xing X, Xiang N, Wu Y, Li C, Chen Q, Li D, Liu T, Zhao J, Liu M, Tu W, Chen C, Jin L, Yang R, Wang Q, Zhou S, Wang R, Liu H, Luo Y, Liu Y, Shao G, Li H, Tao Z, Yang Y, Deng Z, Liu B, Ma Z, Zhang Y, Shi G, Lam TTY, Wu JT, Gao GF, Cowling BJ, Yang B, Leung GM, Feng Z. Early transmission dynamics in Wuhan, China, of novel coronavirus-infected pneumonia. N Engl J Med. 2020;382(13):1199–1207. doi: 10.1056/NEJMoa2001316. - DOI - PMC - PubMed
-
- Statement on the second meeting of the International Health Regulations . Emergency Committee regarding the outbreak of novel coronavirus (2019-nCoV) 2005.
MeSH terms
LinkOut - more resources
Full Text Sources
Other Literature Sources
Medical
Miscellaneous
