

Epidural cerebellar stimulation drives widespread neural synchrony in the intact and stroke perilesional cortex
- PMID: 34039346
- PMCID: PMC8157634
- DOI: 10.1186/s12984-021-00881-9
Epidural cerebellar stimulation drives widespread neural synchrony in the intact and stroke perilesional cortex
Abstract
Background: Cerebellar electrical stimulation has shown promise in improving motor recovery post-stroke in both rodent and human studies. Past studies have used motor evoked potentials (MEPs) to evaluate how cerebellar stimulation modulates ongoing activity in the cortex, but the underlying mechanisms are incompletely understood. Here we used invasive electrophysiological recordings from the intact and stroke-injured rodent primary motor cortex (M1) to assess how epidural cerebellar stimulation modulates neural dynamics at the level of single neurons as well as at the level of mesoscale dynamics.
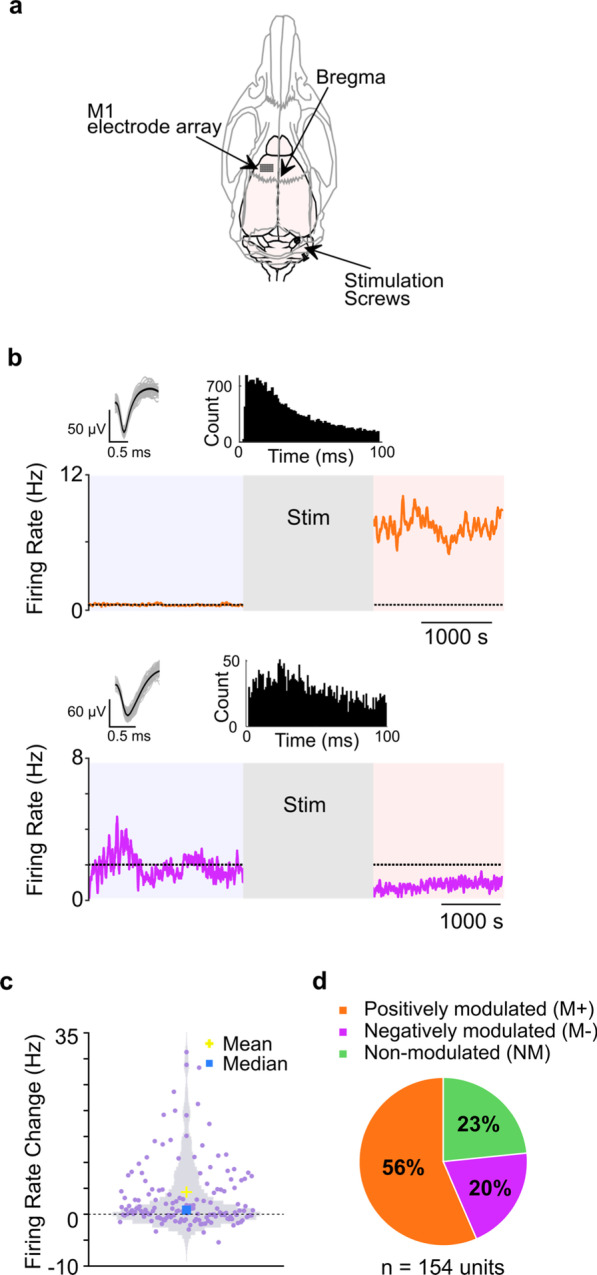
Methods: We recorded single unit spiking and local field potentials (LFPs) in both the intact and acutely stroke-injured M1 contralateral to the stimulated cerebellum in adult Long-Evans rats under anesthesia. We analyzed changes in the firing rates of single units, the extent of synchronous spiking and power spectral density (PSD) changes in LFPs during and post-stimulation.
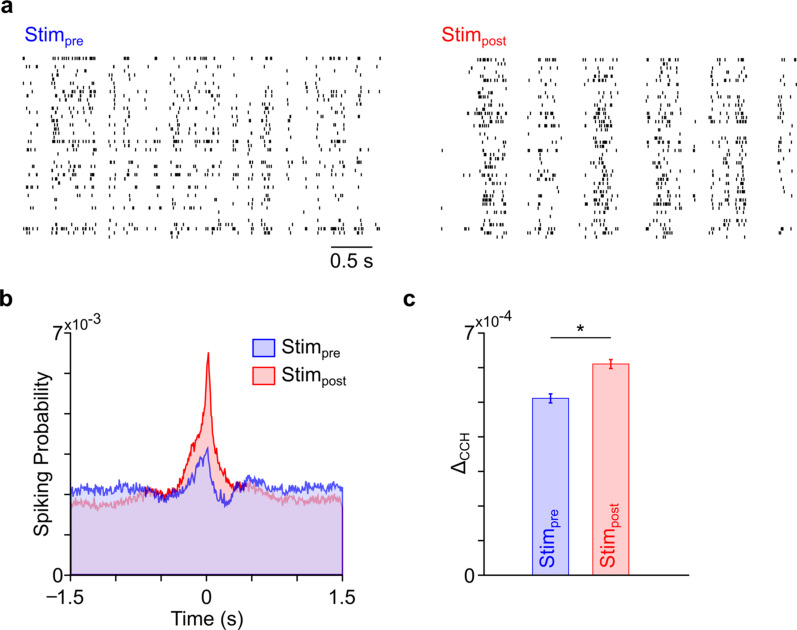
Results: Our results show that post-stimulation, the firing rates of a majority of M1 neurons changed significantly with respect to their baseline rates. These firing rate changes were diverse in character, as the firing rate of some neurons increased while others decreased. Additionally, these changes started to set in during stimulation. Furthermore, cross-correlation analysis showed a significant increase in coincident firing amongst neuronal pairs. Interestingly, this increase in synchrony was unrelated to the direction of firing rate change. We also found that neuronal ensembles derived through principal component analysis were more active post-stimulation. Lastly, these changes occurred without a significant change in the overall spectral power of LFPs post-stimulation.
Conclusions: Our results show that cerebellar stimulation caused significant, long-lasting changes in the activity patterns of M1 neurons by altering firing rates, boosting neural synchrony and increasing neuronal assemblies' activation strength. Our study provides evidence that cerebellar stimulation can directly modulate cortical dynamics. Since these results are present in the perilesional cortex, our data might also help explain the facilitatory effects of cerebellar stimulation post-stroke.
Keywords: Cerebellum; Epidural direct current stimulation; Motor cortex; Neural plasticity.
Conflict of interest statement
The authors declare that they have no competing interests.
Figures


Similar articles
-
Large-scale changes in cortical dynamics triggered by repetitive somatosensory electrical stimulation.J Neuroeng Rehabil. 2019 May 24;16(1):59. doi: 10.1186/s12984-019-0520-1. J Neuroeng Rehabil. 2019. PMID: 31126339 Free PMC article.
-
Spinal cord direct current stimulation differentially modulates neuronal activity in the dorsal and ventral spinal cord.J Neurophysiol. 2017 Mar 1;117(3):1143-1155. doi: 10.1152/jn.00584.2016. Epub 2016 Dec 28. J Neurophysiol. 2017. PMID: 28031400 Free PMC article.
-
Modulation of Neural Spiking in Motor Cortex-Cerebellar Networks during Sleep Spindles.eNeuro. 2024 May 6;11(5):ENEURO.0150-23.2024. doi: 10.1523/ENEURO.0150-23.2024. Print 2024 May. eNeuro. 2024. PMID: 38641414 Free PMC article.
-
Deep brain stimulation of the cerebellum for poststroke motor rehabilitation: from laboratory to clinical trial.Neurosurg Focus. 2018 Aug;45(2):E13. doi: 10.3171/2018.5.FOCUS18164. Neurosurg Focus. 2018. PMID: 30064319 Review.
-
Non-invasive Cerebellar Stimulation: a Promising Approach for Stroke Recovery?Cerebellum. 2018 Jun;17(3):359-371. doi: 10.1007/s12311-017-0906-1. Cerebellum. 2018. PMID: 29243202 Review.
Cited by
-
Disturbed laterality of non-rapid eye movement sleep oscillations in post-stroke human sleep: a pilot study.Front Neurol. 2023 Nov 30;14:1243575. doi: 10.3389/fneur.2023.1243575. eCollection 2023. Front Neurol. 2023. PMID: 38099067 Free PMC article.
-
Targeting Sensory and Motor Integration for Recovery of Movement After CNS Injury.Front Neurosci. 2022 Jan 21;15:791824. doi: 10.3389/fnins.2021.791824. eCollection 2021. Front Neurosci. 2022. PMID: 35126040 Free PMC article. Review.
-
Emergent Low-Frequency Activity in Cortico-Cerebellar Networks with Motor Skill Learning.eNeuro. 2023 Feb 21;10(2):ENEURO.0011-23.2023. doi: 10.1523/ENEURO.0011-23.2023. Print 2023 Feb. eNeuro. 2023. PMID: 36750360 Free PMC article.
-
Dynamic electrophysiological changes in abnormal brain cavities post-ischemic stroke.Front Neurosci. 2025 May 16;19:1565255. doi: 10.3389/fnins.2025.1565255. eCollection 2025. Front Neurosci. 2025. PMID: 40454248 Free PMC article.
-
Cortico-cerebellar coordination facilitates neuroprosthetic control.Sci Adv. 2024 Apr 12;10(15):eadm8246. doi: 10.1126/sciadv.adm8246. Epub 2024 Apr 12. Sci Adv. 2024. PMID: 38608024 Free PMC article.
References
Publication types
MeSH terms
Grants and funding
LinkOut - more resources
Full Text Sources
Other Literature Sources
Medical
Miscellaneous
